
HOW DOES PRICING WORK?
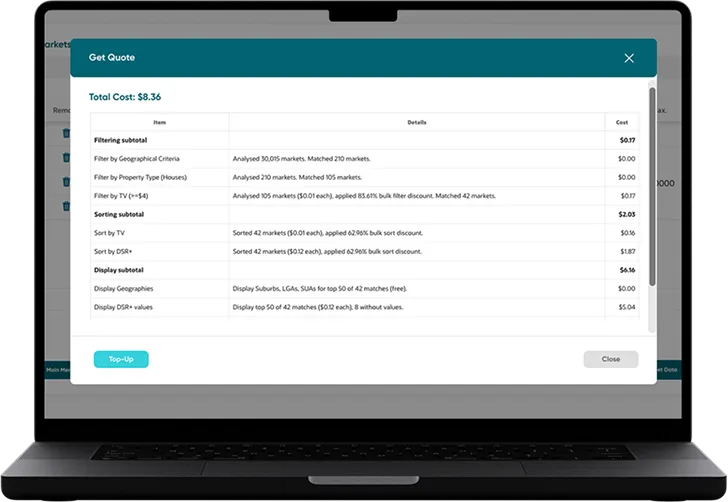
You only pay for what you request. You'll always see the cost before you commit.
Hypothetical examples only. Actual costs depend on the tools, markets and metrics selected.
Amount spent
$28.92
Quick Suburb Shortlist
A price range and yield target are entered. The system scans Australia and returns 20 markets with strong growth potential and low risk.
Amount spent
$47.40
Heat Map Research
A visual, flexible approach. A heat map filters suburbs across a chosen city to instantly surface the best areas by key metrics.
Amount spent
$0.46
Monthly Monitoring
An investor already holds a property. Each month they log in to check vacancy rates and track equity to know when to buy again.
Pay Only For What You Use,
and Only When You Use It
Top up your account and use your balance whenever you're ready. Credits remain valid for 12 months from the date of purchase. See the price before every query and decide if it's worth it to you.
- No subscriptions or monthly fees
- Credits valid for 12 months from purchase
- Full price transparency
Top Up & Get Bonus Credits
The more you top up, the more research you unlock bonus credits added instantly.
Top up
$30
You get
$30
Standard top up
Top up
$100
You get
$115
$15 bonus
Top up
$300
You get
$360
$60 bonus
Top up
$500
You get
$625
$125 bonus
Top up
$1,000
You get
$1,300
$300 bonus
No subscription · Use across every tool & metric · Credits valid for 12 months from purchase
How much will it cost?
Depends on your situation, diligence, attitude to data, experience, and research method.
Estimated total
$140 to $525
You don't have to, but ideally you'd spend $1,000.
Filter and sort markets to find potential hotspots. Cost depends on your filters and how many times you refine them.
Visualise hot areas and spot the epicentre of heat. Cost depends on how many areas you check and extra metrics you add.
Examine a wide range of metrics for suburbs of interest. Cost depends on how many suburbs and metrics you want.
Check for volatility and long term trends like DSR, Typical Values and Vacancy. Cost depends on charts, markets, history length and re-dos.
Compare a suburb to the wider market. Essential for filtering in Suburb Search. Cost depends on metrics and markets compared.
Why it's worth it
1000x
A $5 chart can save you thousands
A DSR chart flags a demand spike as a one off. You skip a $500k property that underperforms by 1%, saving $5,000.
100x
Data pays for itself many times over
Spend $500 on data, buy a $500k property, outperform by $50,000. That's a 100x return.
See How It Works
Watch a quick walkthrough of how credits, tools, and pricing work together.
Why It's Better This Way
Test Drive
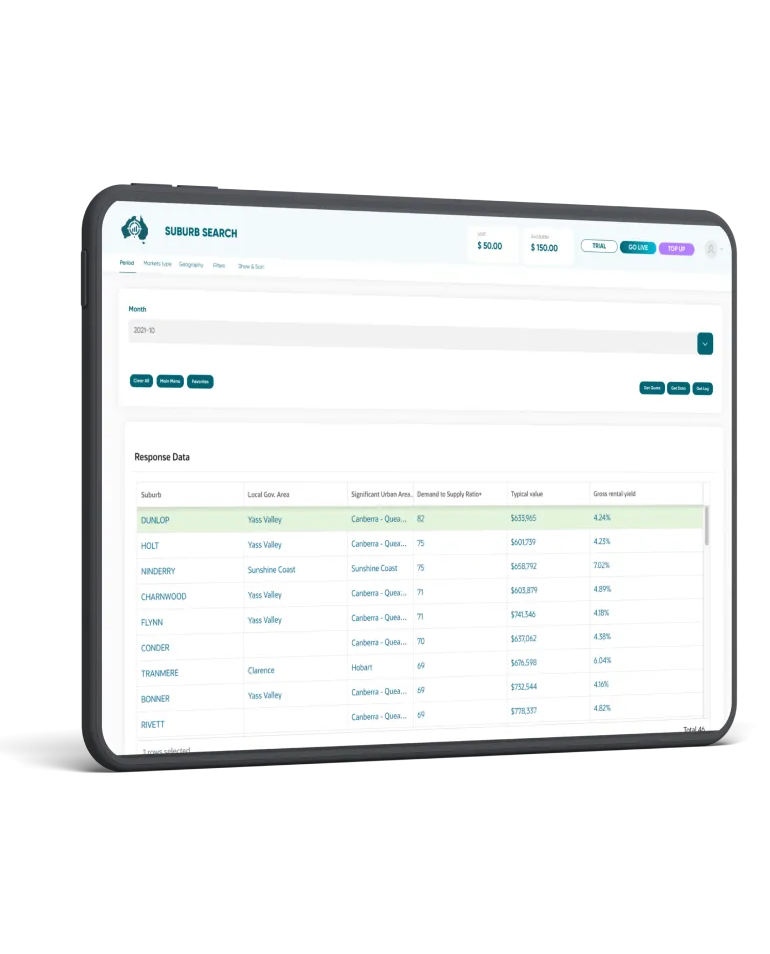
Start your journey to informed decisions with full access but limited to mock data.
Quick Quote
Get an instant quote for any report before you commit. No surprises, complete transparency.
Flexible Payment
Use credits valid for 12 months from purchase, or schedule regular top-ups. No refund required.