

Warren Buffett's famous quote pops up whenever there is fear in the property market. Talk of war, economic mayhem, an interest rate cycle, or a real estate professional spotting a slow-down and reaching for the maxim:
"Be greedy when others are fearful, be fearful when others are greedy."
Buffett's advice is good for share investors. We tested whether it works for property in Australia, across 35 years of historical data. It does not.
Share Investors and Property Owners Are Different
Share investors buy and sell purely for financial gain. The share market is driven by fear and greed.
The property market is not. Two-thirds of property owners are owner-occupiers. They need somewhere to live. Very few sell their home to stop losses in a falling market.
If fear and greed are weaker forces in property, Buffett's quote may not apply.
Test 1: Online Search Interest
A fearful owner wants to sell. A greedy buyer wants to buy. Fear and greed can be measured by the count of potential buyers against the count of potential sellers.
SuburbData tracks this as Online Search Interest, or OSI. OSI compares the number of online searches by buyers against the number of properties listed for sale in the same area.
A high OSI means many buyers chasing few listings. Greed. A low OSI means few buyers and many listings. Fear.
We have been recording OSI since 2010.
The chart below shows the relationship between an Online Search Interest measurement and the capital growth that followed in the 3 years after measurement.
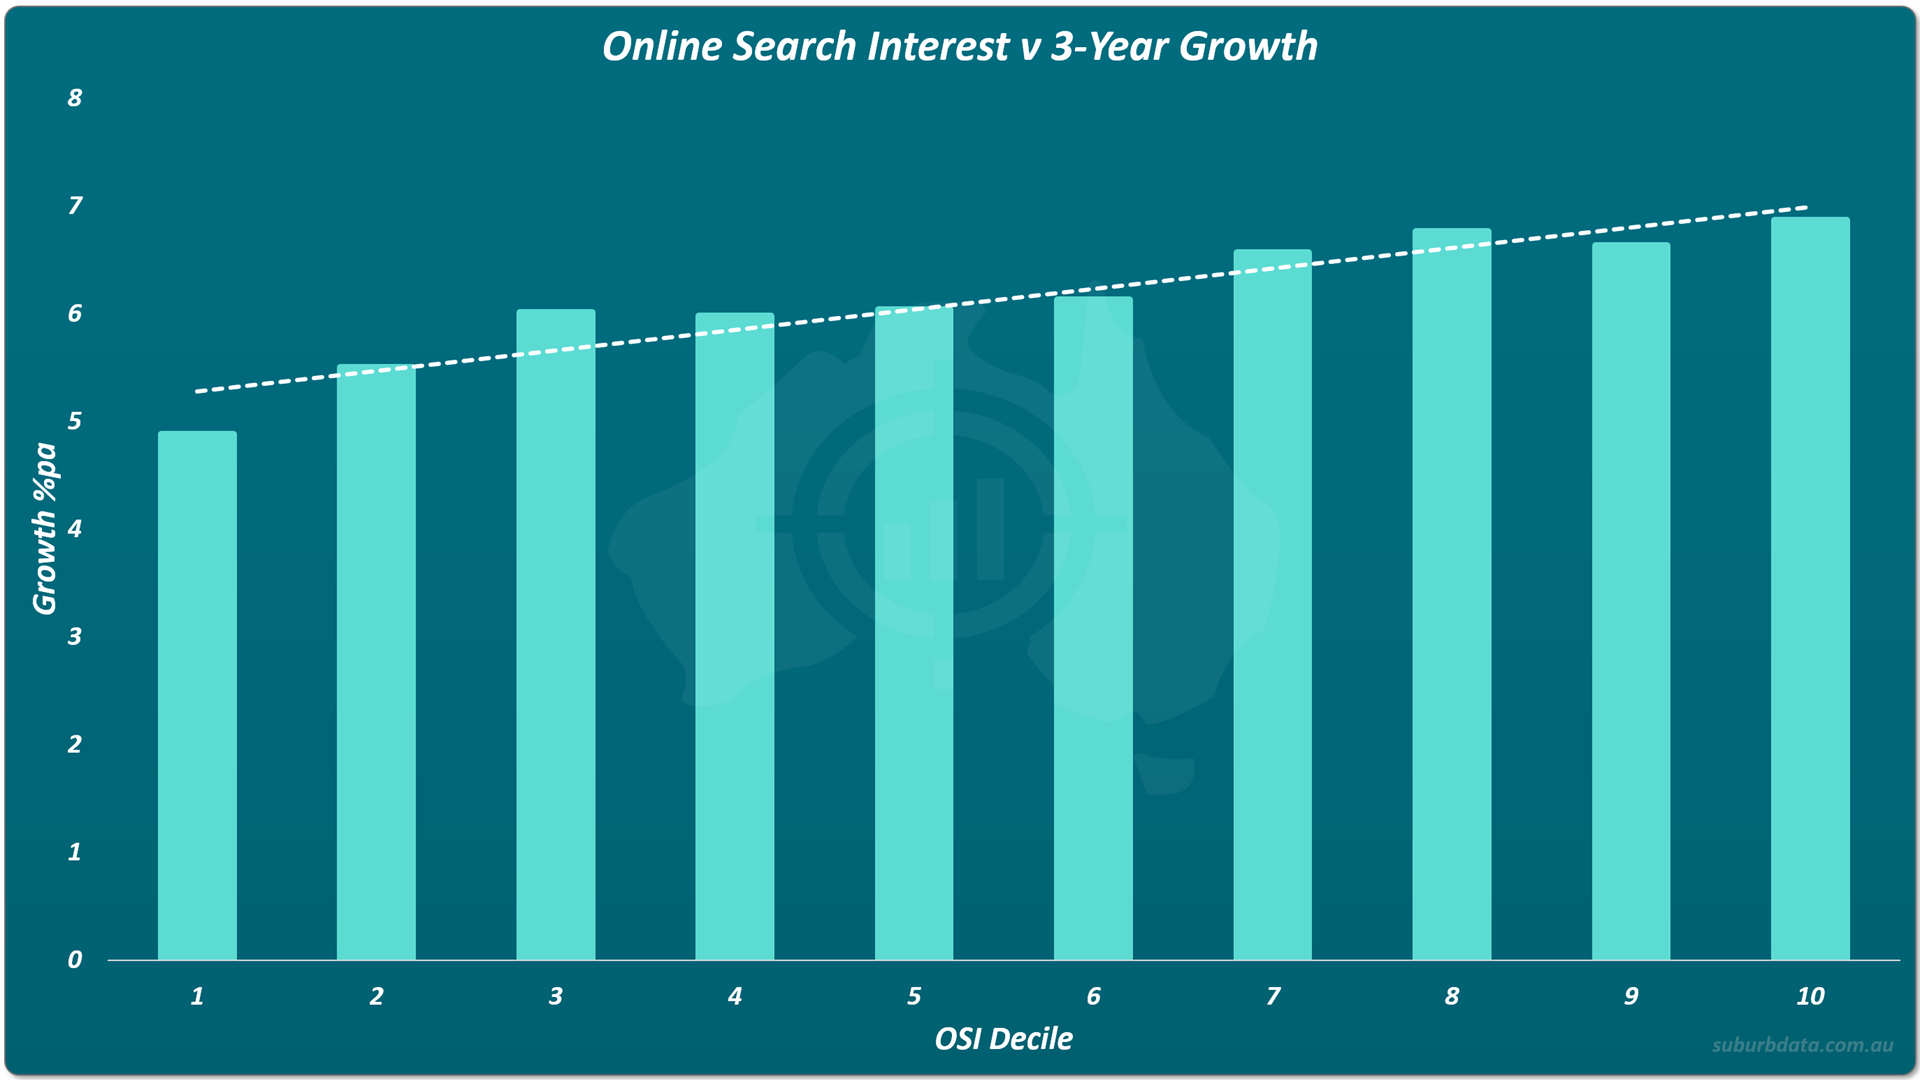
The far left bar is the group of suburbs with very low OSI. The far right is the group with high OSI. The higher the greed, the higher the growth. Investors who bought in fearful markets received less growth over the next 3 years than investors who bought in greedy ones.
Test 2: Price Direction
Price direction could be a better measure. Falling prices signal fear. Rising prices signal greed.
If Buffett's principle held, buying into a falling market should reward the contrarian over the next few years. But…
We examined growth rates of every Australian property market over any 12-month period across 35 years. Data was aggregated to the SA3 level for reliable calculations. SA3 is short for Statistical Area Level 3, an ABS-defined region about the size of a local government area. That still produced over 100,000 cases, so we grouped them into 1,000 sample points and measured the growth that followed.
The chart below shows the relationship between a market's 12-month price growth and its growth over the following 3 years.
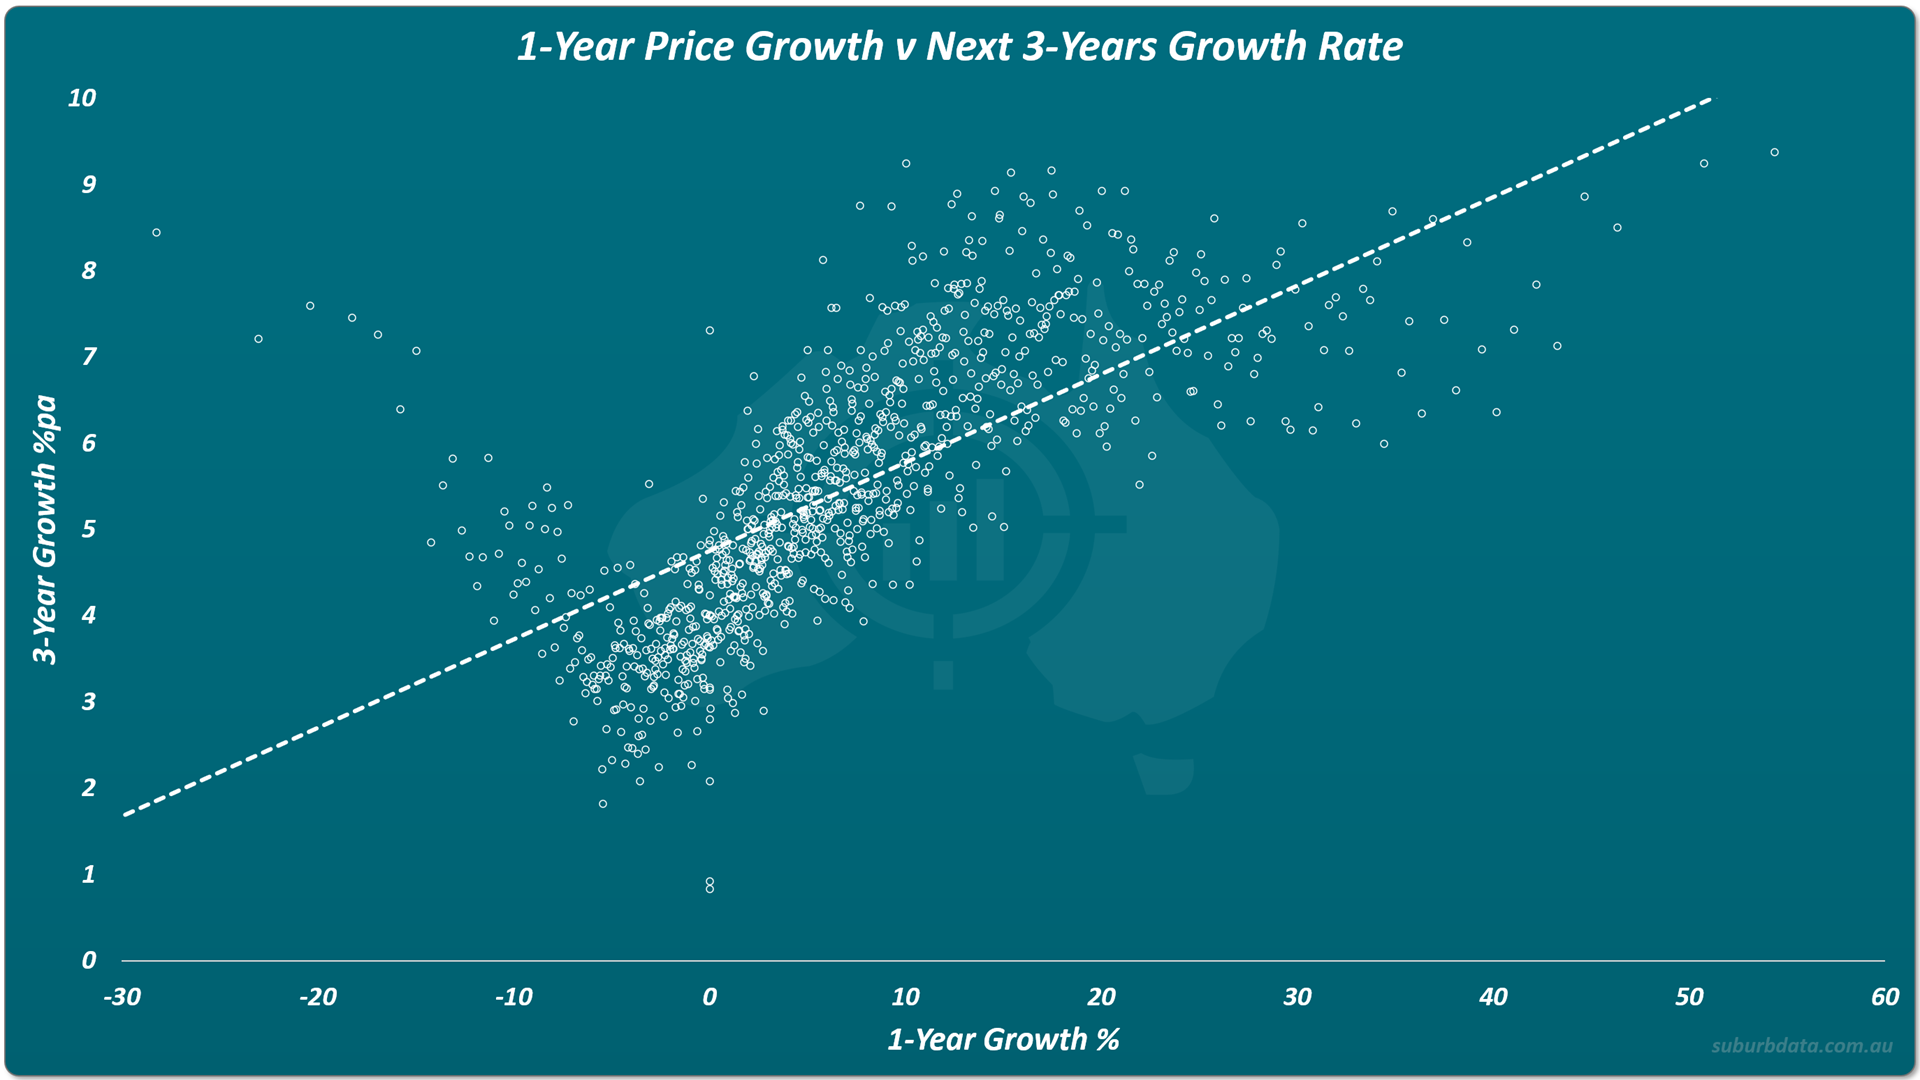
Markets with poor 12-month growth went on to produce poor 3-year growth. Markets with strong 12-month growth went on to produce strong 3-year growth.
The same analysis at a 5-year horizon.
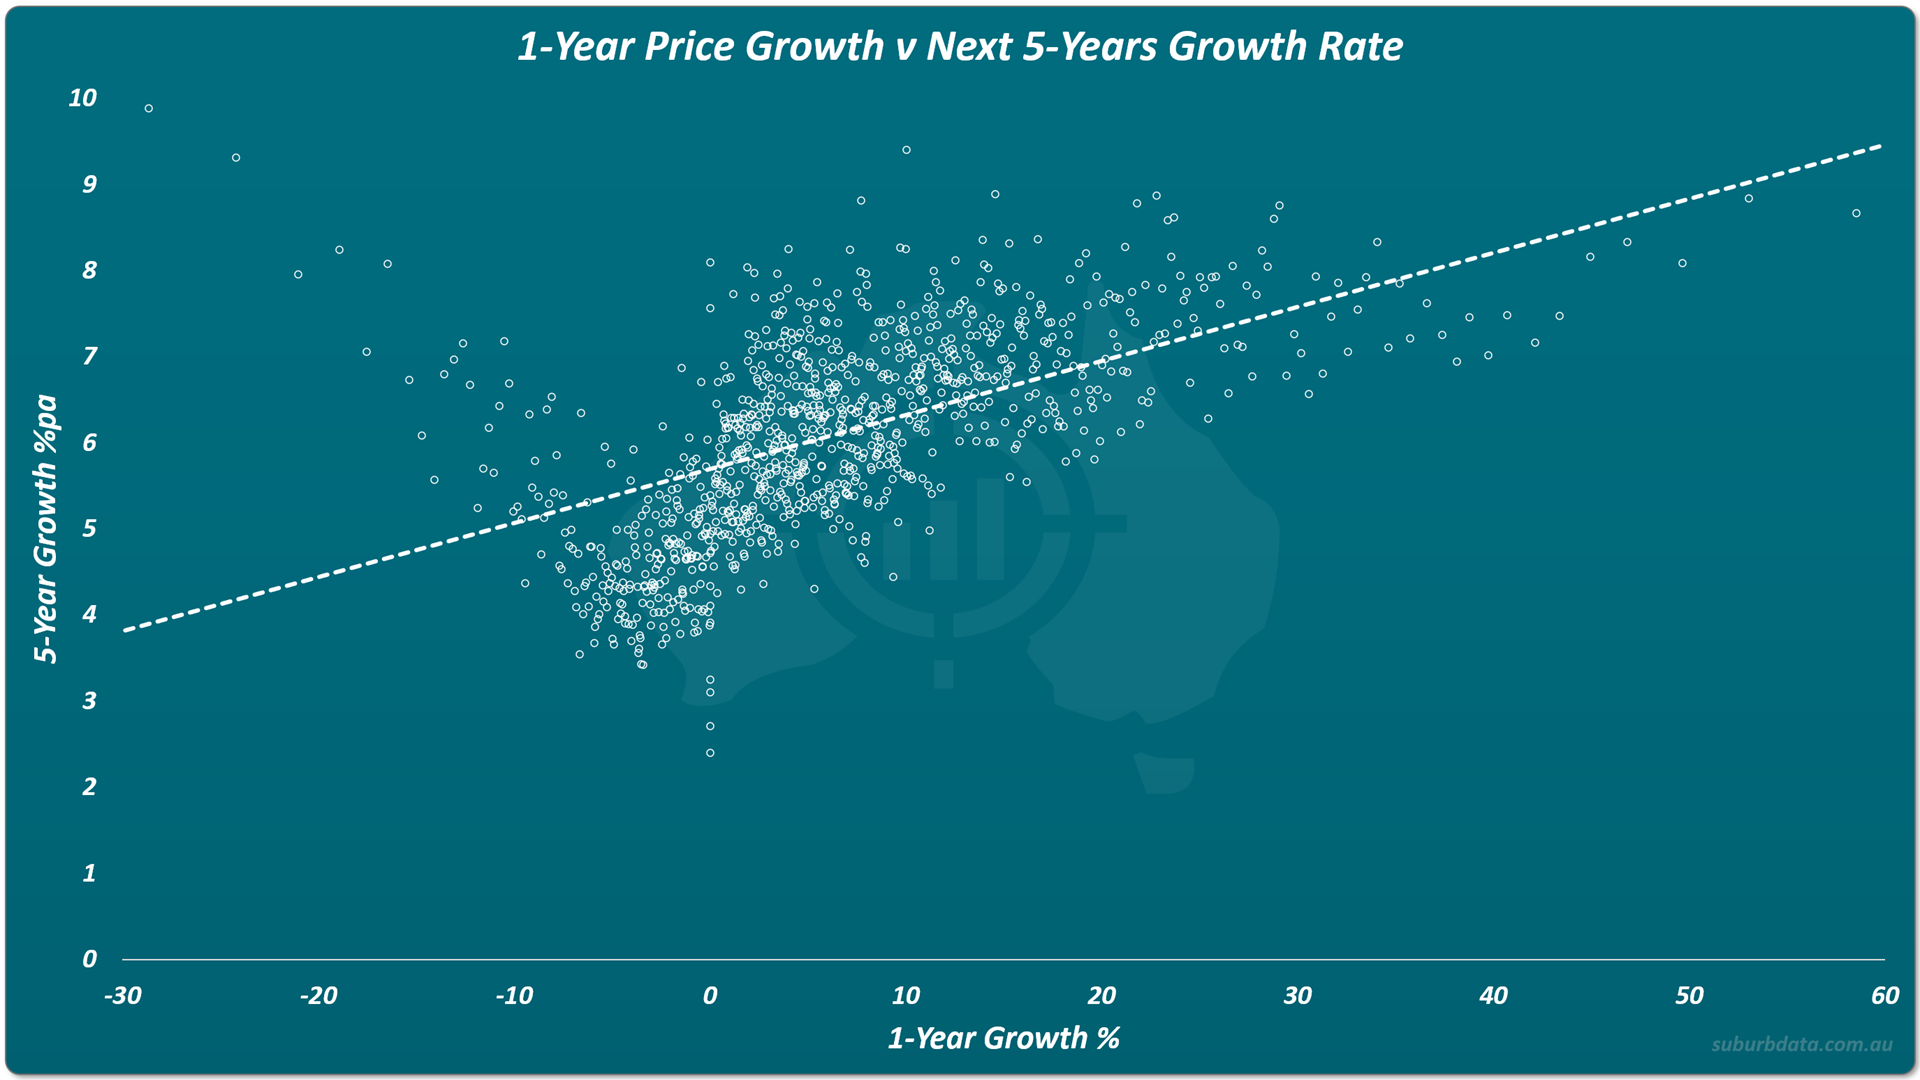
The trend line is gentler at 5 years. The direction is the same. Following a rising market is a more profitable strategy than following a falling one.
Two Real Examples
The chart below shows the typical value of a house in Port Hedland, a West Australian mining town, from late 2013 to early 2026.
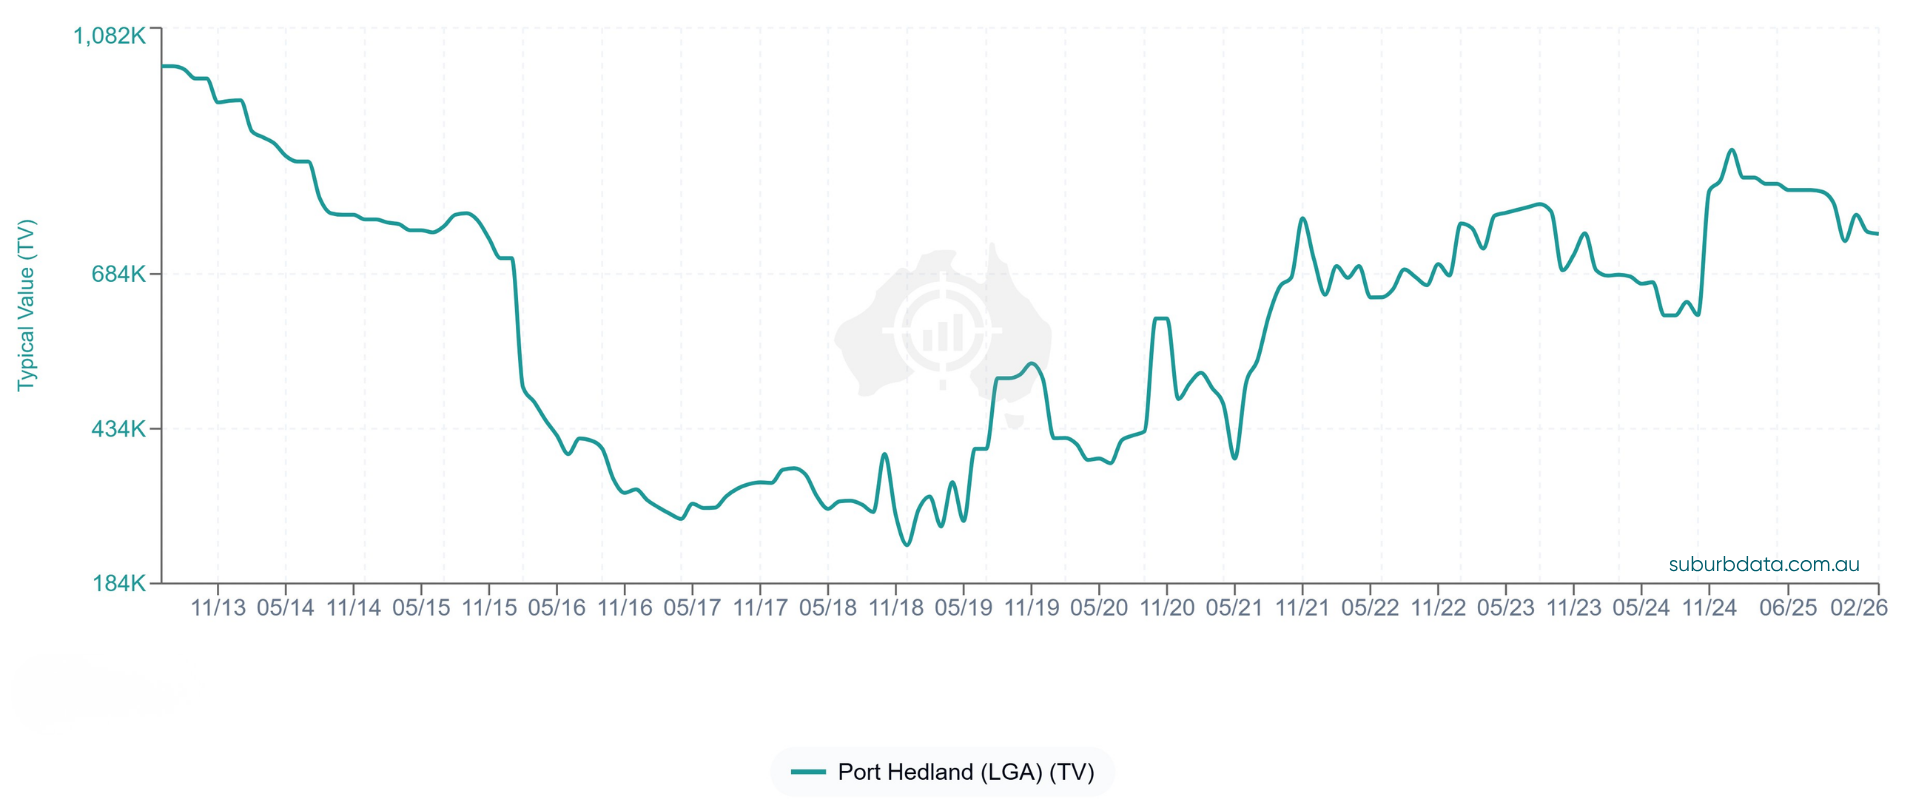
Prices for a house were about $1 million in mid-2013. Commodity prices fell and the resources sector took a hit. Prices collapsed to around $250,000 by 2017.
Investors who bought in 2013 (during the fear) would still be in the red over a decade later. Investors who bought in 2014 (still fear) would barely be breaking even now.
Only investors who bought in 2017, 2018, or 2019 (greed) outperformed the broader market.
The chart below shows the typical value for a house in Sydney from early 2012 to early 2018.
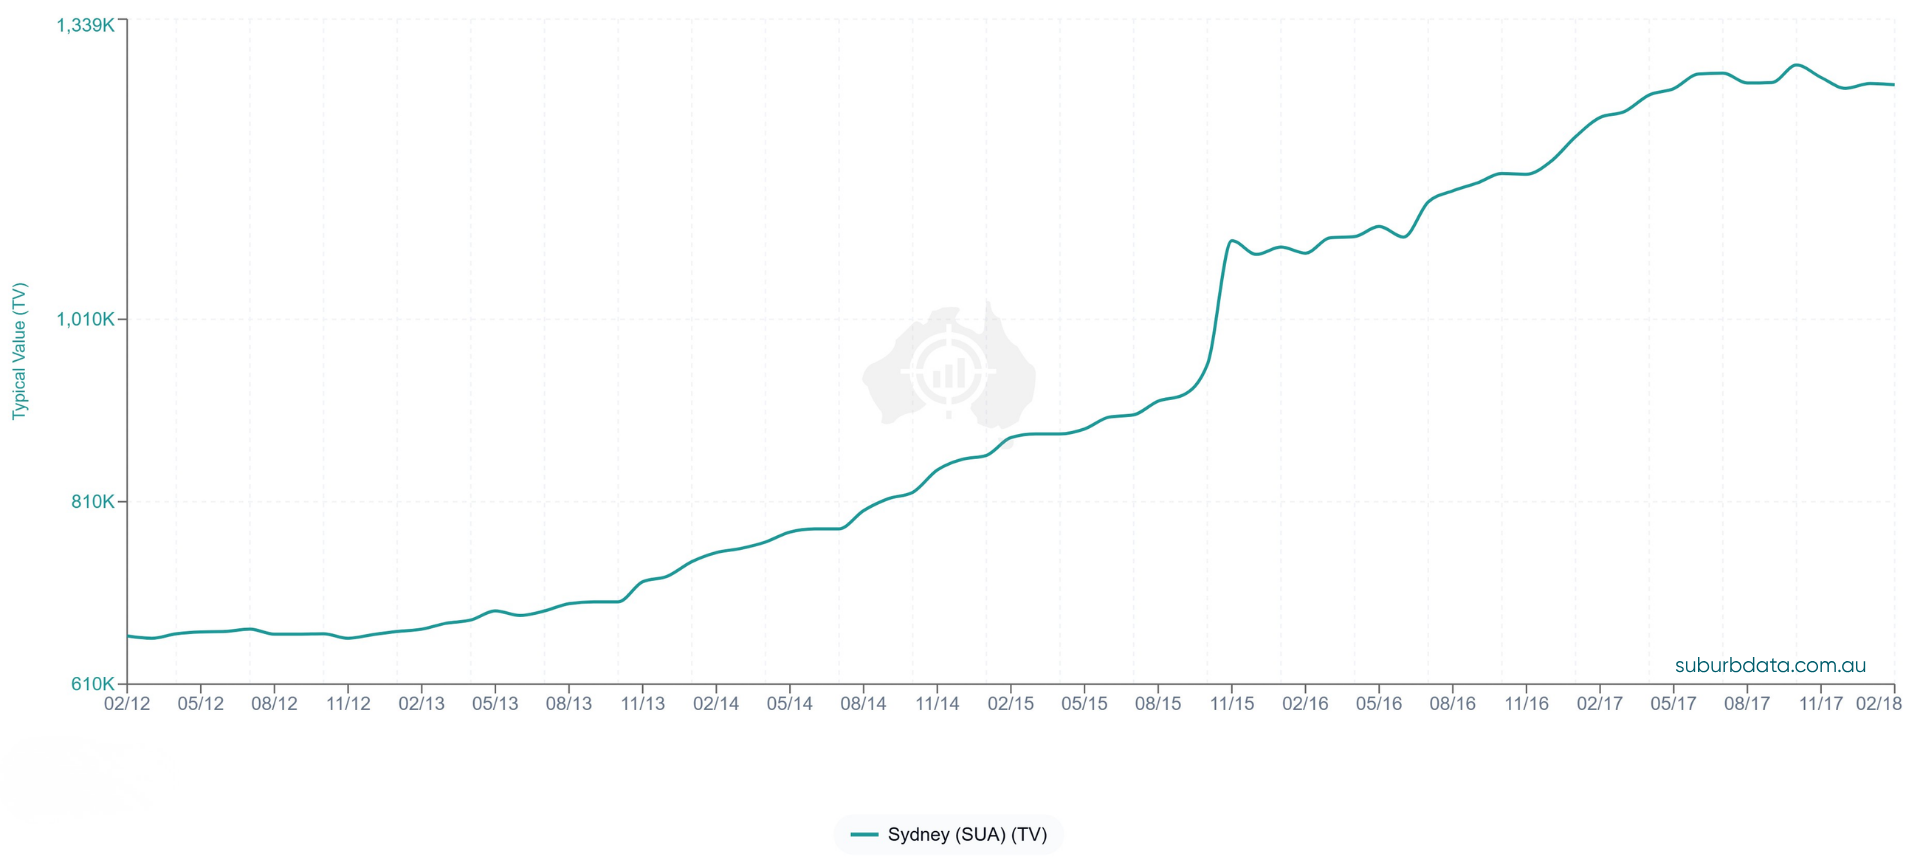
Sydney house prices from early 2012 to early 2018 tell the opposite story. Media blamed "greedy property investors" for pushing prices up. One high-profile expert told her clients in 2014 that Sydney was "overheated."
That mistake cost her clients around half a million dollars in three years.
In both cases, the mood (greed) and the growth lasted for years.
Why Buffett's Principle Does Not Apply to Property
Three structural differences explain why a strategy that works for shares does not work for property.
Property is slow. A share trade takes minutes. A property trade takes weeks or months. Property is around 100,000 times slower to transact than the share market.
Property has trading costs. Buying involves stamp duty, legal fees, and building and pest inspections. Selling involves agent's commission and legal fees. None of these apply to shares in any significant way.
Most property owners are not investors. Two-thirds are owner-occupiers who need shelter. They do not sell when prices fall.
The Contrarian Reframe
A contrarian strategy can still work in property. The terms need translating.
The property equivalent of "fear" is a buyer's market: supply exceeds demand, properties are easy to buy. The equivalent of "greed" is a seller's market: demand exceeds supply, properties are easy to sell.
Supply and demand are the sole dictators of price growth. When demand exceeds supply, prices rise. To catch growth, the investor needs to buy when demand exceeds supply.
That means buying in a seller's market.
Translated for property, Buffett's maxim becomes: be greedy when others are greedy. Buy in a seller's market.
Conclusion
Buffett's advice may work perfectly in the share market. Historically, it has not worked in property in Australia.
Three measures of fear and greed across 35 years all pointed the same way. Greedy markets outperformed fearful ones.
In property, be greedy when others are greedy. If a contrarian view is essential, the property equivalent is to buy in a seller's market.
The advice to be fearful in a hot property market is not just wrong. It mistakes a share market principle for a universal one.