

Many Australian property investors are told to target high income suburbs or areas with strong income growth.
The logic sounds compelling. Higher wages should mean stronger buying power, more demand, and therefore stronger capital growth.
But when this theory is tested against long-term Australian property market data, it breaks down.
This article explains why income-based suburb selection does not work in practice, and why relying on intuition instead of data-driven suburb research often leads investors in the wrong direction.
The Wage Growth to Renovation to Capital Growth Assumption
The most common argument looks like this.
Wages rise in a suburb Residents can afford renovations Renovations improve the suburb Property prices increase
On the surface, this feels intuitive. But the logic weakens as soon as you follow the money.
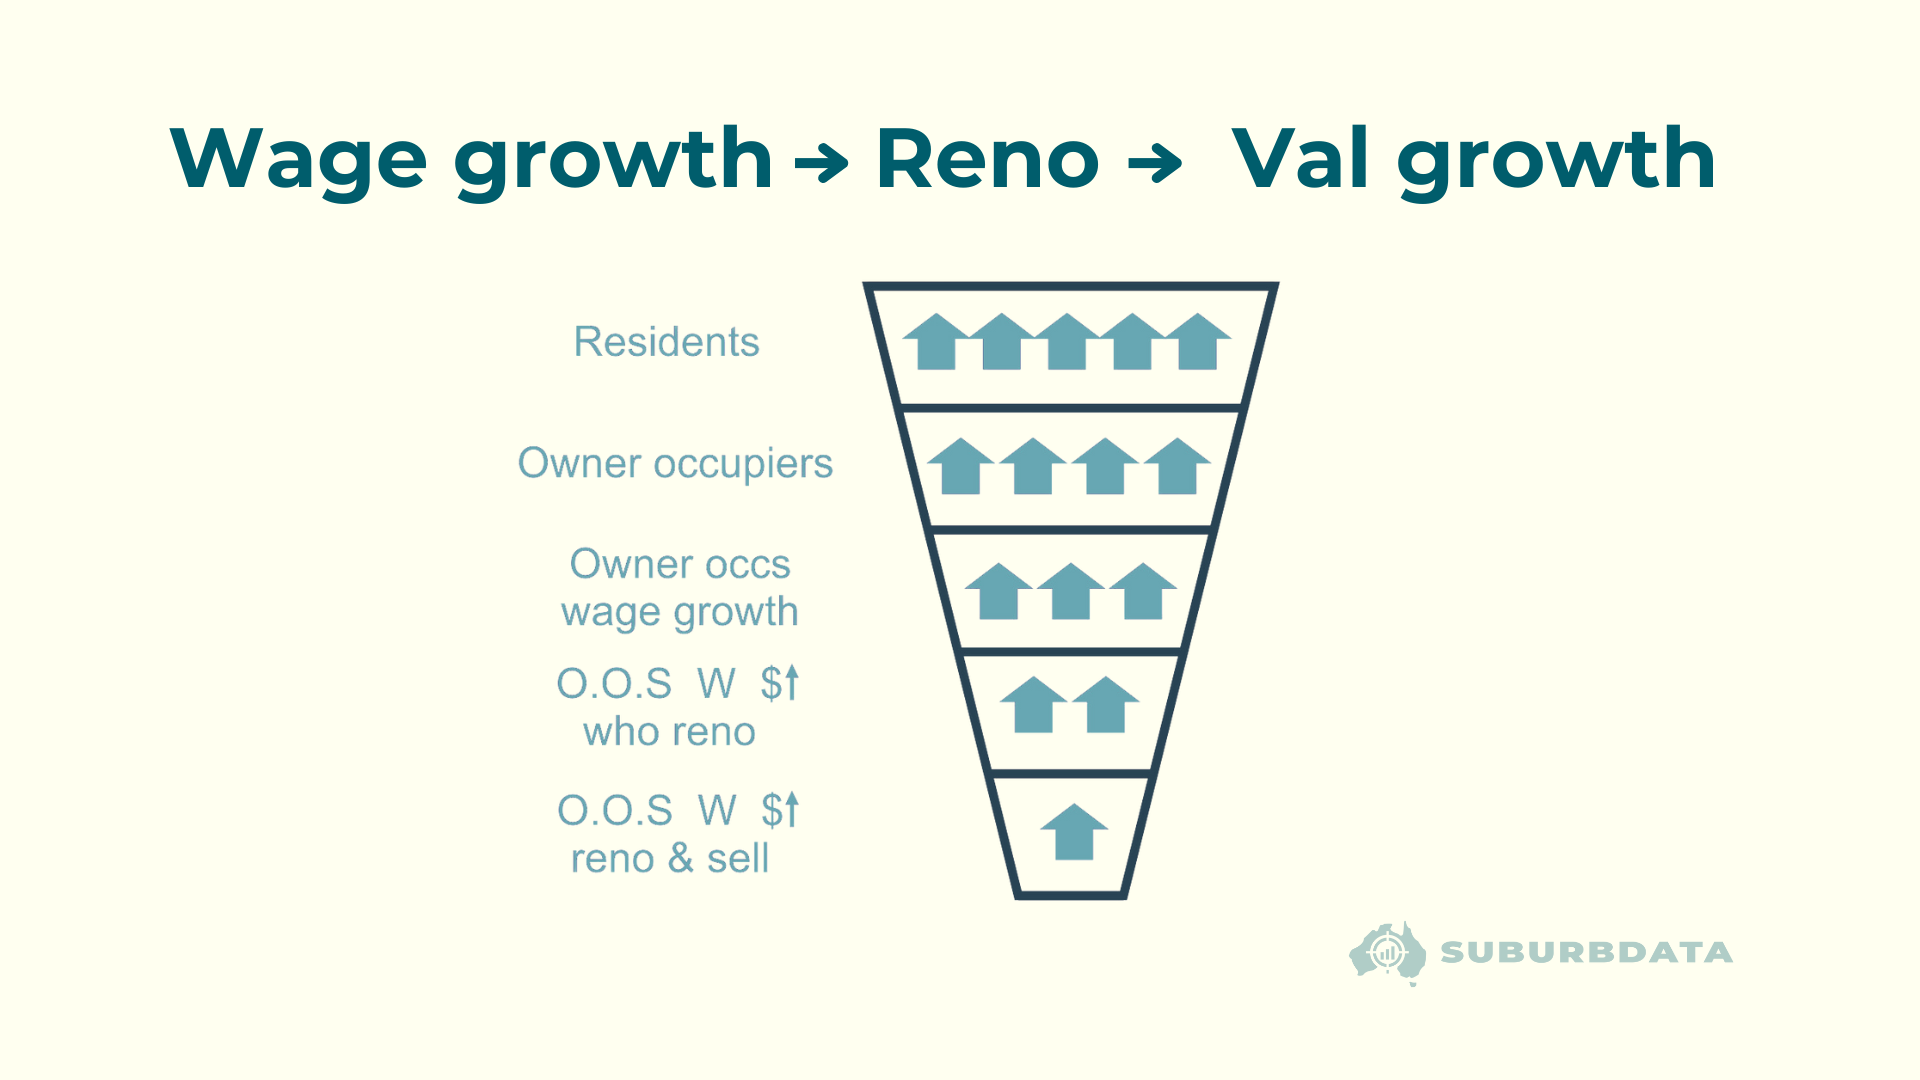
This theory requires an unlikely chain of events.
Tenants cannot renovate properties they do not own, removing roughly 33 percent of residents immediately.
Of the remaining owner occupiers, many will not receive wage growth at all. Some are retired or semi-retired.
Of those who do receive wage growth, many will choose not to renovate. They may prioritise lifestyle spending, investments, or debt reduction.
Of those who renovate, most do so for personal use, not resale.
And only a very small fraction renovate and then sell soon after.
By the end of this chain, you are relying on a tiny minority of properties to lift prices across an entire suburb.
That is not a reliable growth mechanism.
Renovations Are Capital Injection, Not Capital Growth
A renovated property will sell for more than an unrenovated property.
An unrenovated property will not value higher simply because there is a renovated property next door.
Buyers Do Not Have to Live There
There's another assumption: that the people receiving wage growth are the same people driving demand. They are not.
Why would a high income earner pay more to buy the property they already own?
Property prices are set by buyers, not by residents. And buyers can come from anywhere.
The wages of residents are irrelevant. It is the wages of buyers that are relevant. And they can live anywhere.
What the Long-Term Data Shows
Rather than relying on theory, this idea can be tested directly.
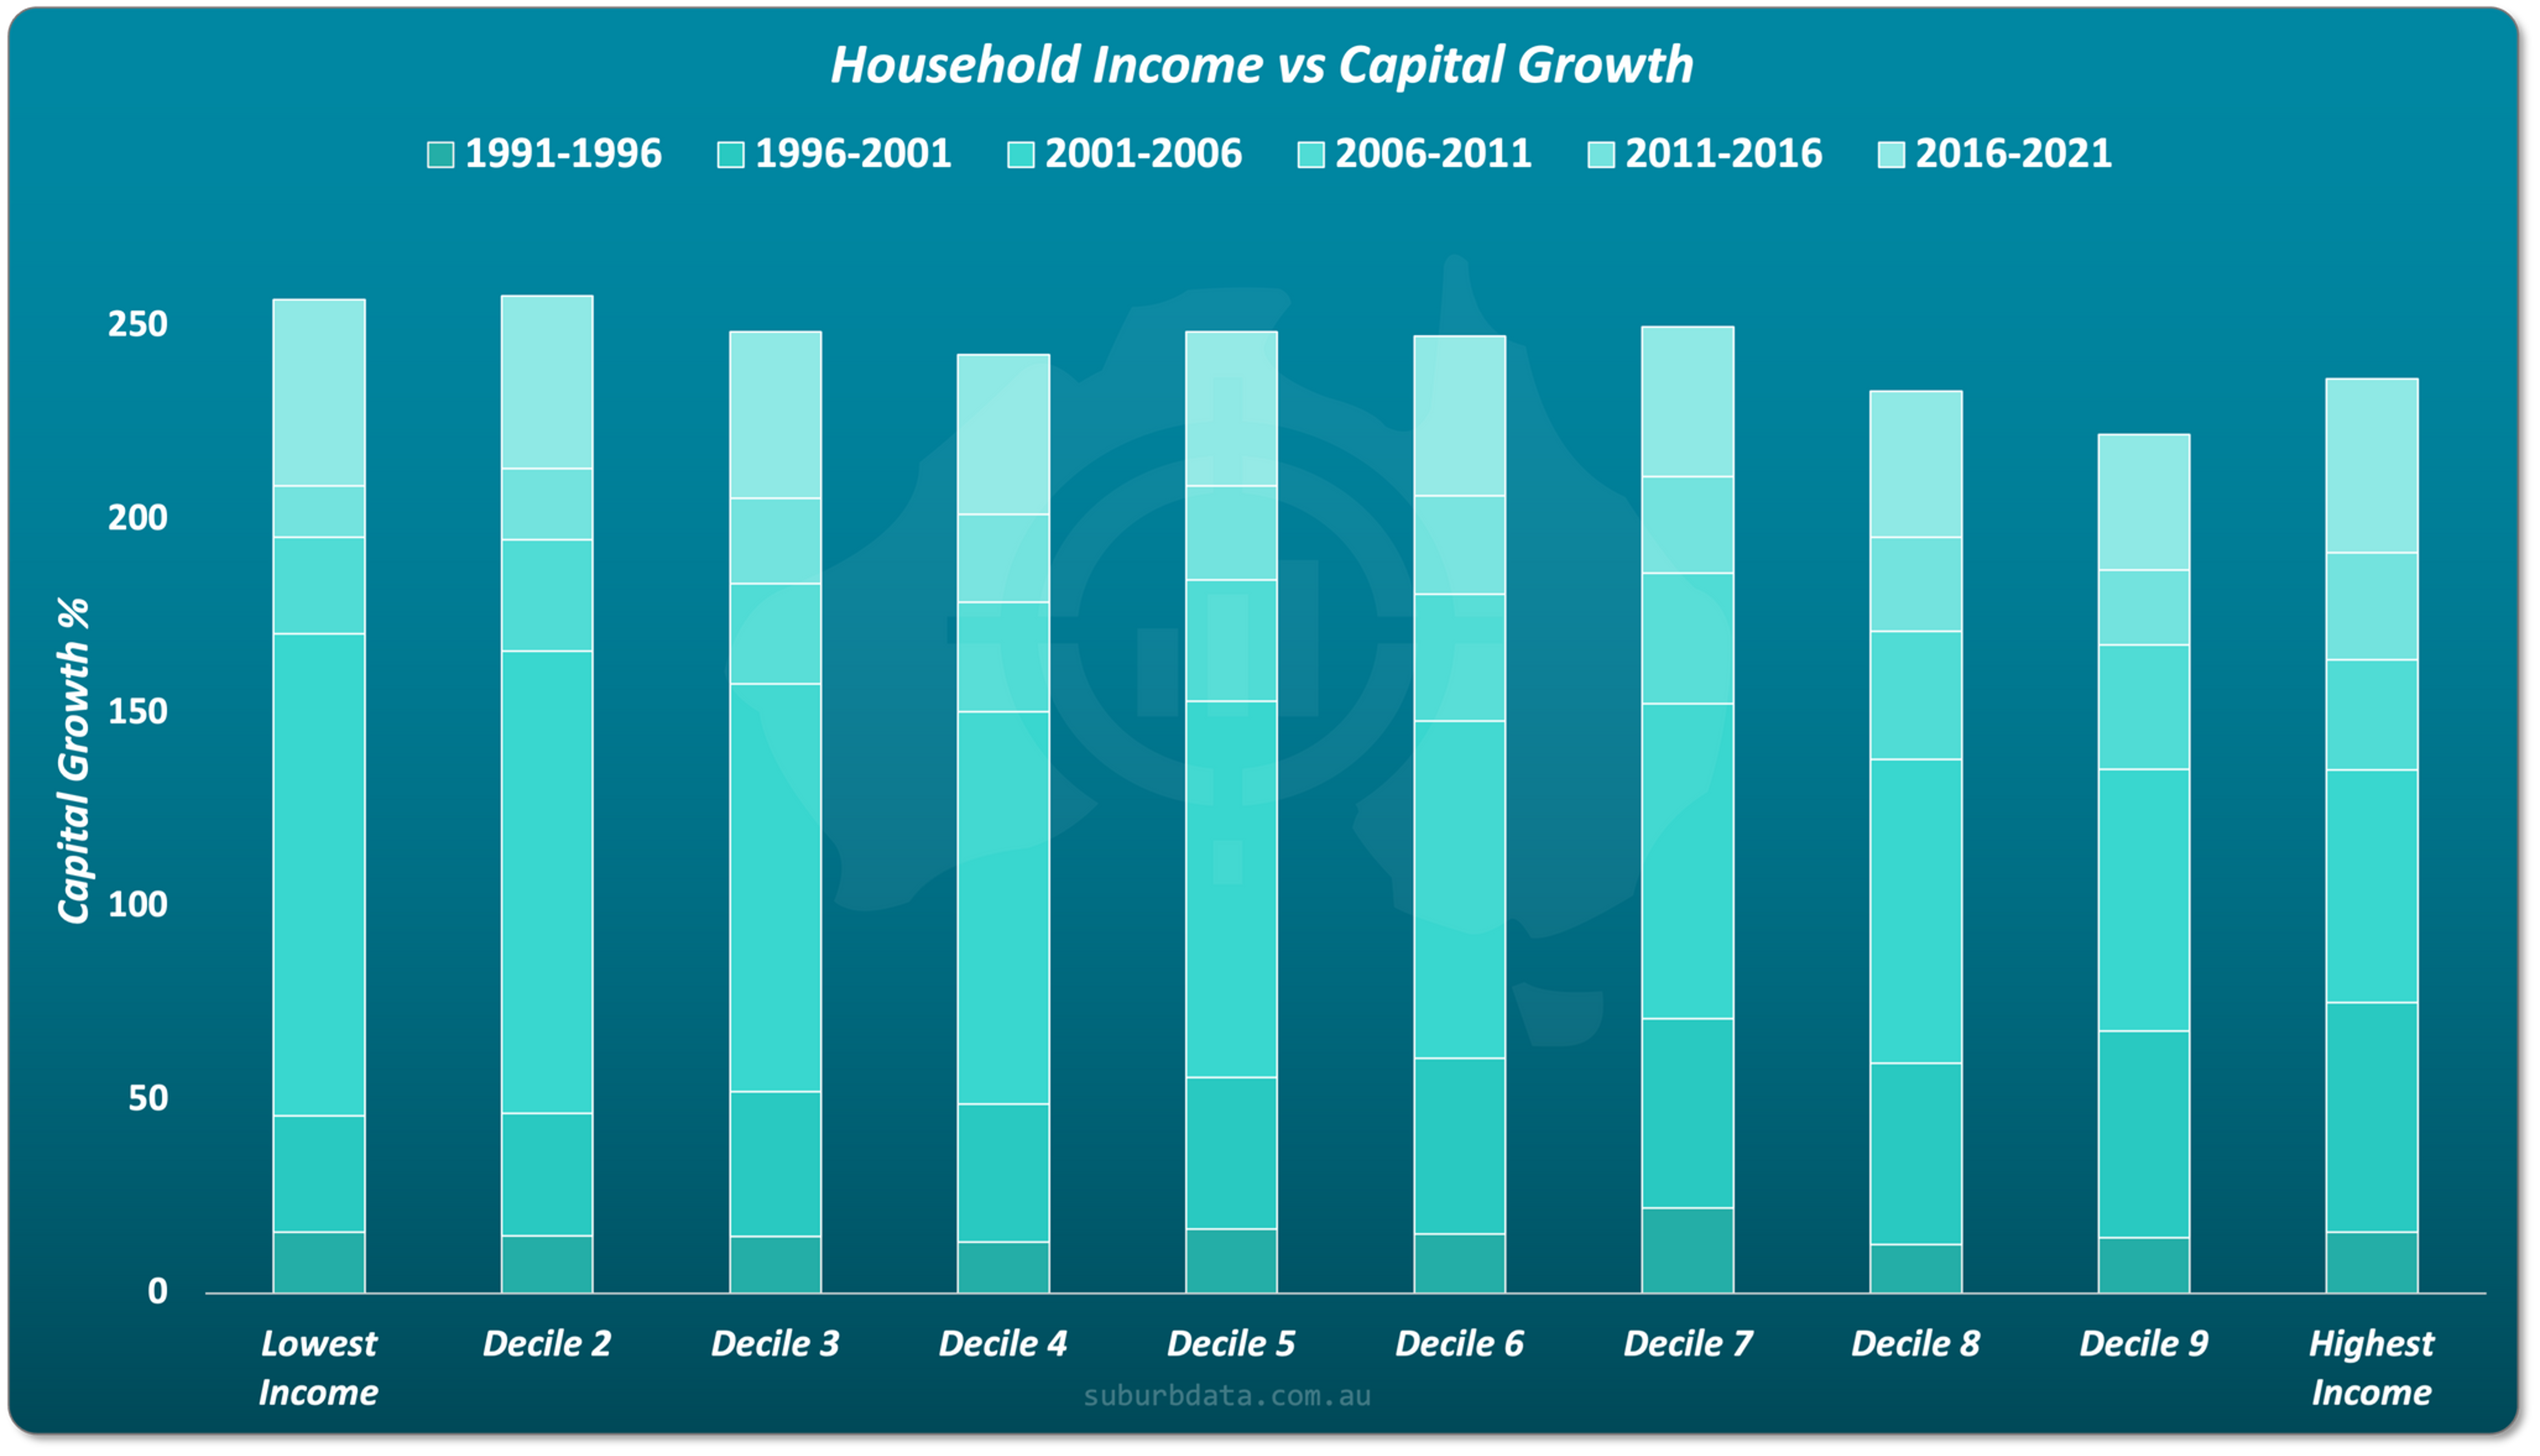
Australian suburbs were grouped into 10 evenly sized income cohorts, known as income deciles. Each decile represents 10 percent of suburbs, ranked by median household income.
Decile 1 contains the lowest income suburbs Decile 10 contains the highest income suburbs
Income data comes from the Australian Bureau of Statistics census records from 1991 to 2021.
Capital growth was then measured across the same 30-year period.
If high incomes drove capital growth, higher income suburbs would clearly outperform.
They do not.
Across 30 years, capital growth is remarkably similar across all income deciles. There is no clear trend favouring high income suburbs.
If income were a meaningful driver, it would appear clearly in long-term data. Instead, the evidence points elsewhere when examining what actually drives capital growth.
Why Timing Creates False Patterns
In the prior chart, each income decile’s total growth is made up of 6 stacked 5-year periods.
When those periods are examined individually, short-term patterns appear.
Some 5-year periods favour higher income suburbs Other periods favour lower income suburbs The trend frequently reverses
This means conclusions depend entirely on when the measurement starts and ends.
Over long timeframes, these advantages cancel out.
This is why income-based strategies fail in real-world investing.
Income Does Not Equal Buying Capacity
Another misconception is that income determines buying power.
In reality, buying capacity depends on multiple factors.
Income Savings behaviour Existing equity
A high income household with poor savings may be less capable of buying than a lower income household with strong discipline.
A retiree with minimal income but significant equity can often outbid both.
Income and buying power are related, but they are not the same thing.
Census Income Data Is Backward Looking
Income data comes from the census, which is conducted once every 5 years.
There can easily be a delay of a year in publishing. So, it is possible to be looking at data that is 6 years old.
Around 40 percent of residents in a typical Australian suburb change within 6 years.
That means the recorded income profile may no longer reflect current residents, let alone active buyers.
Buyers Are Not Localised
At an auction, one fact is clear.
If buyers turn up and bid, they can afford to buy.
What is unknown is where they live, how much they earn, or where their wealth comes from.
Buyers may be upgrading, downsizing, relocating, or investing from entirely different regions.
This is why resident income data is a poor proxy for demand.

Does Income Growth Perform Any Better?
Some investors accept that income levels do not matter, but argue that income growth does.
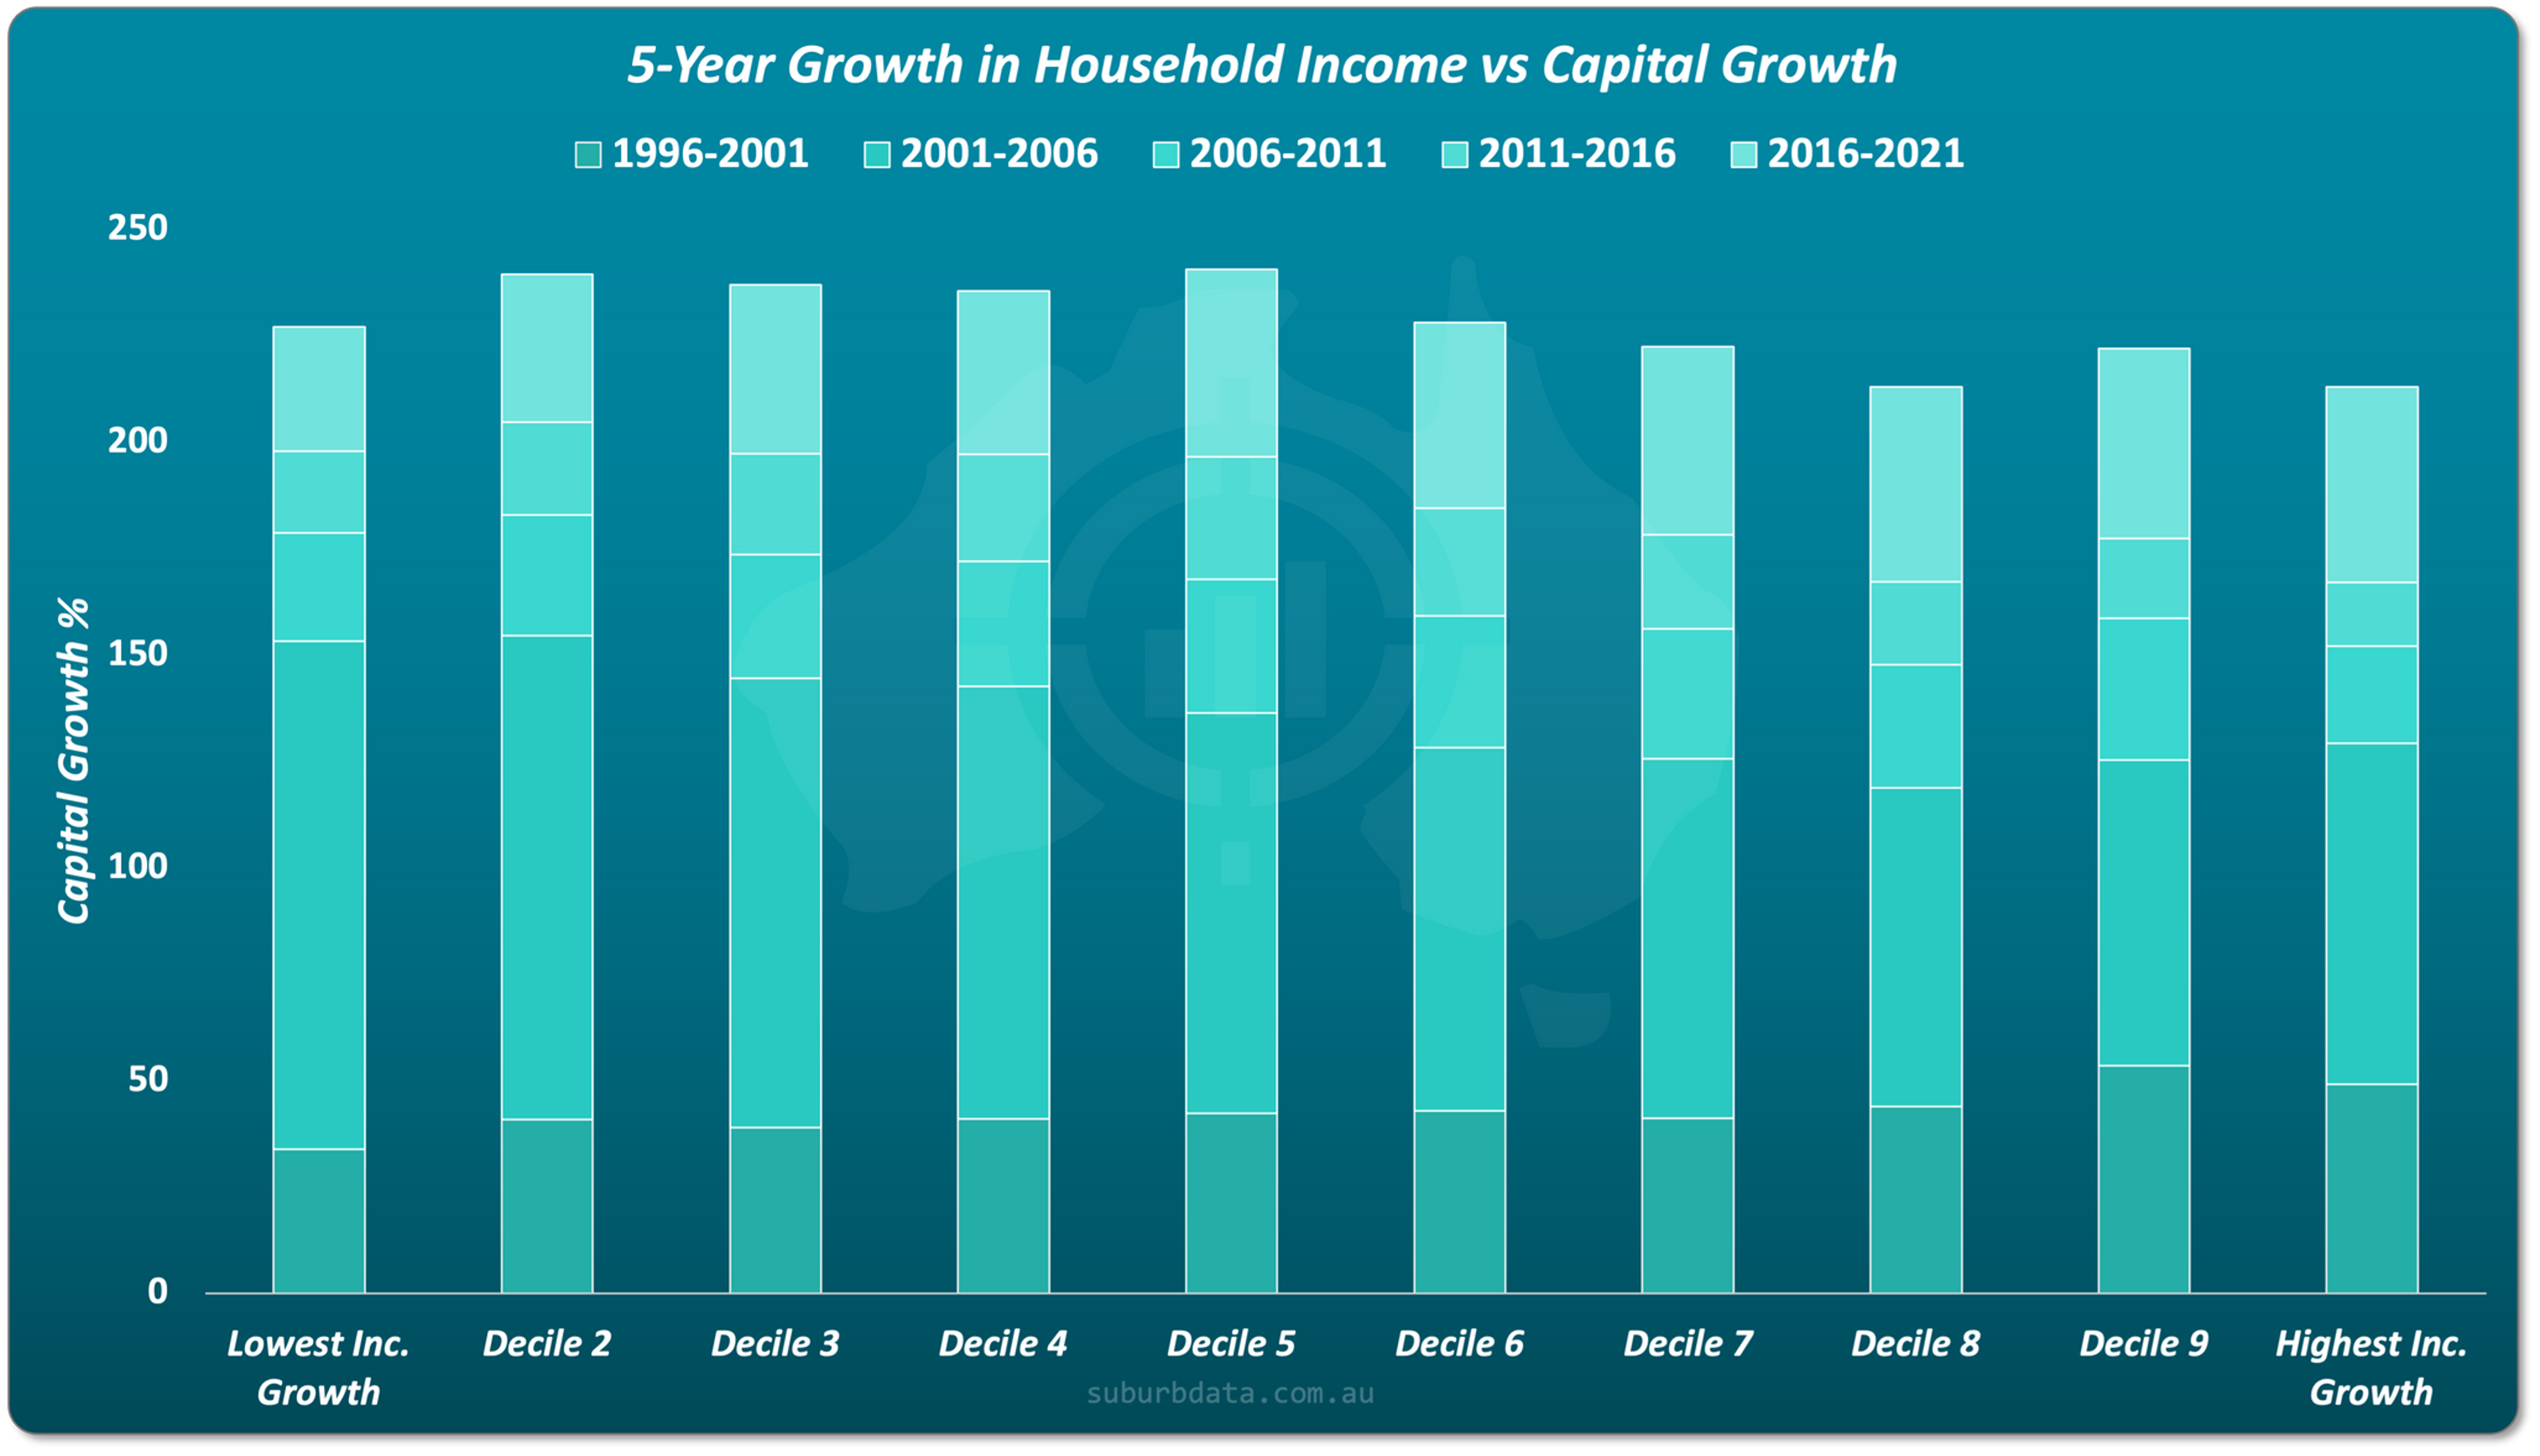
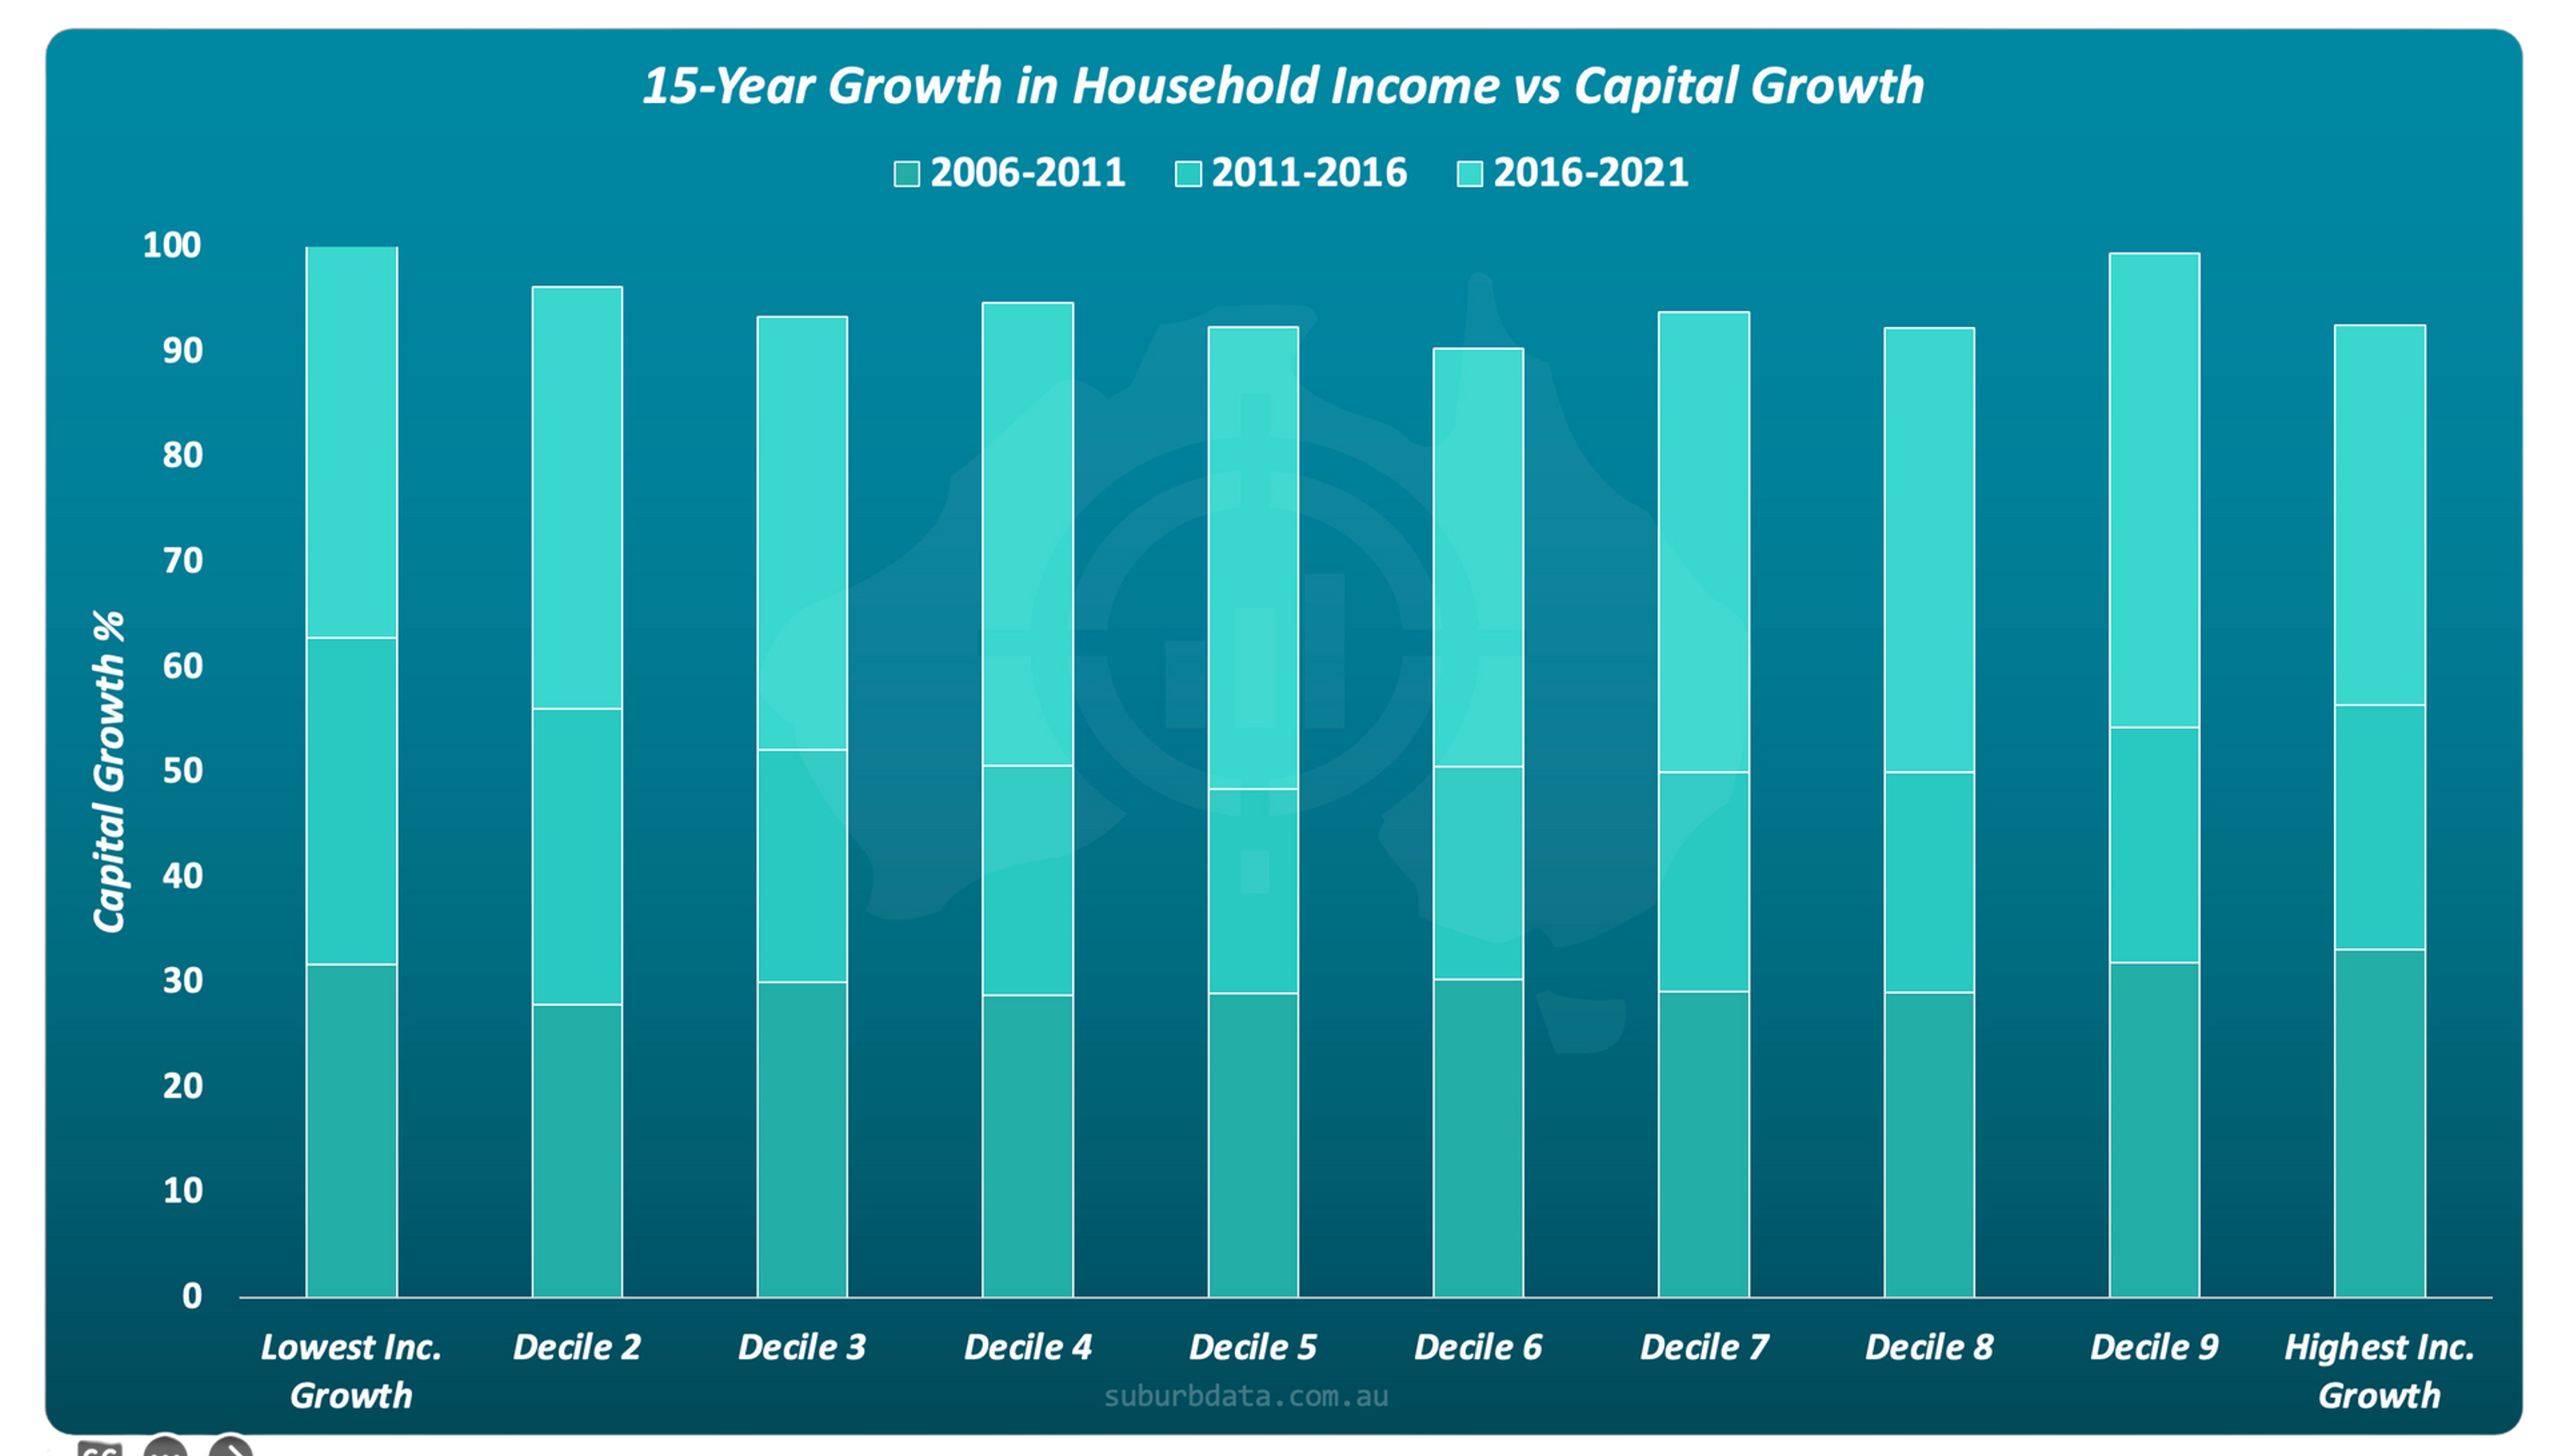
To test this, suburbs were ranked by income growth and compared with subsequent capital growth.
5-Year Income Growth Suburbs with the fastest income growth should outperform if the theory holds.
They do not.
Some periods favour high income growth suburbs. The next period reverses.
Over time, total growth is effectively flat.
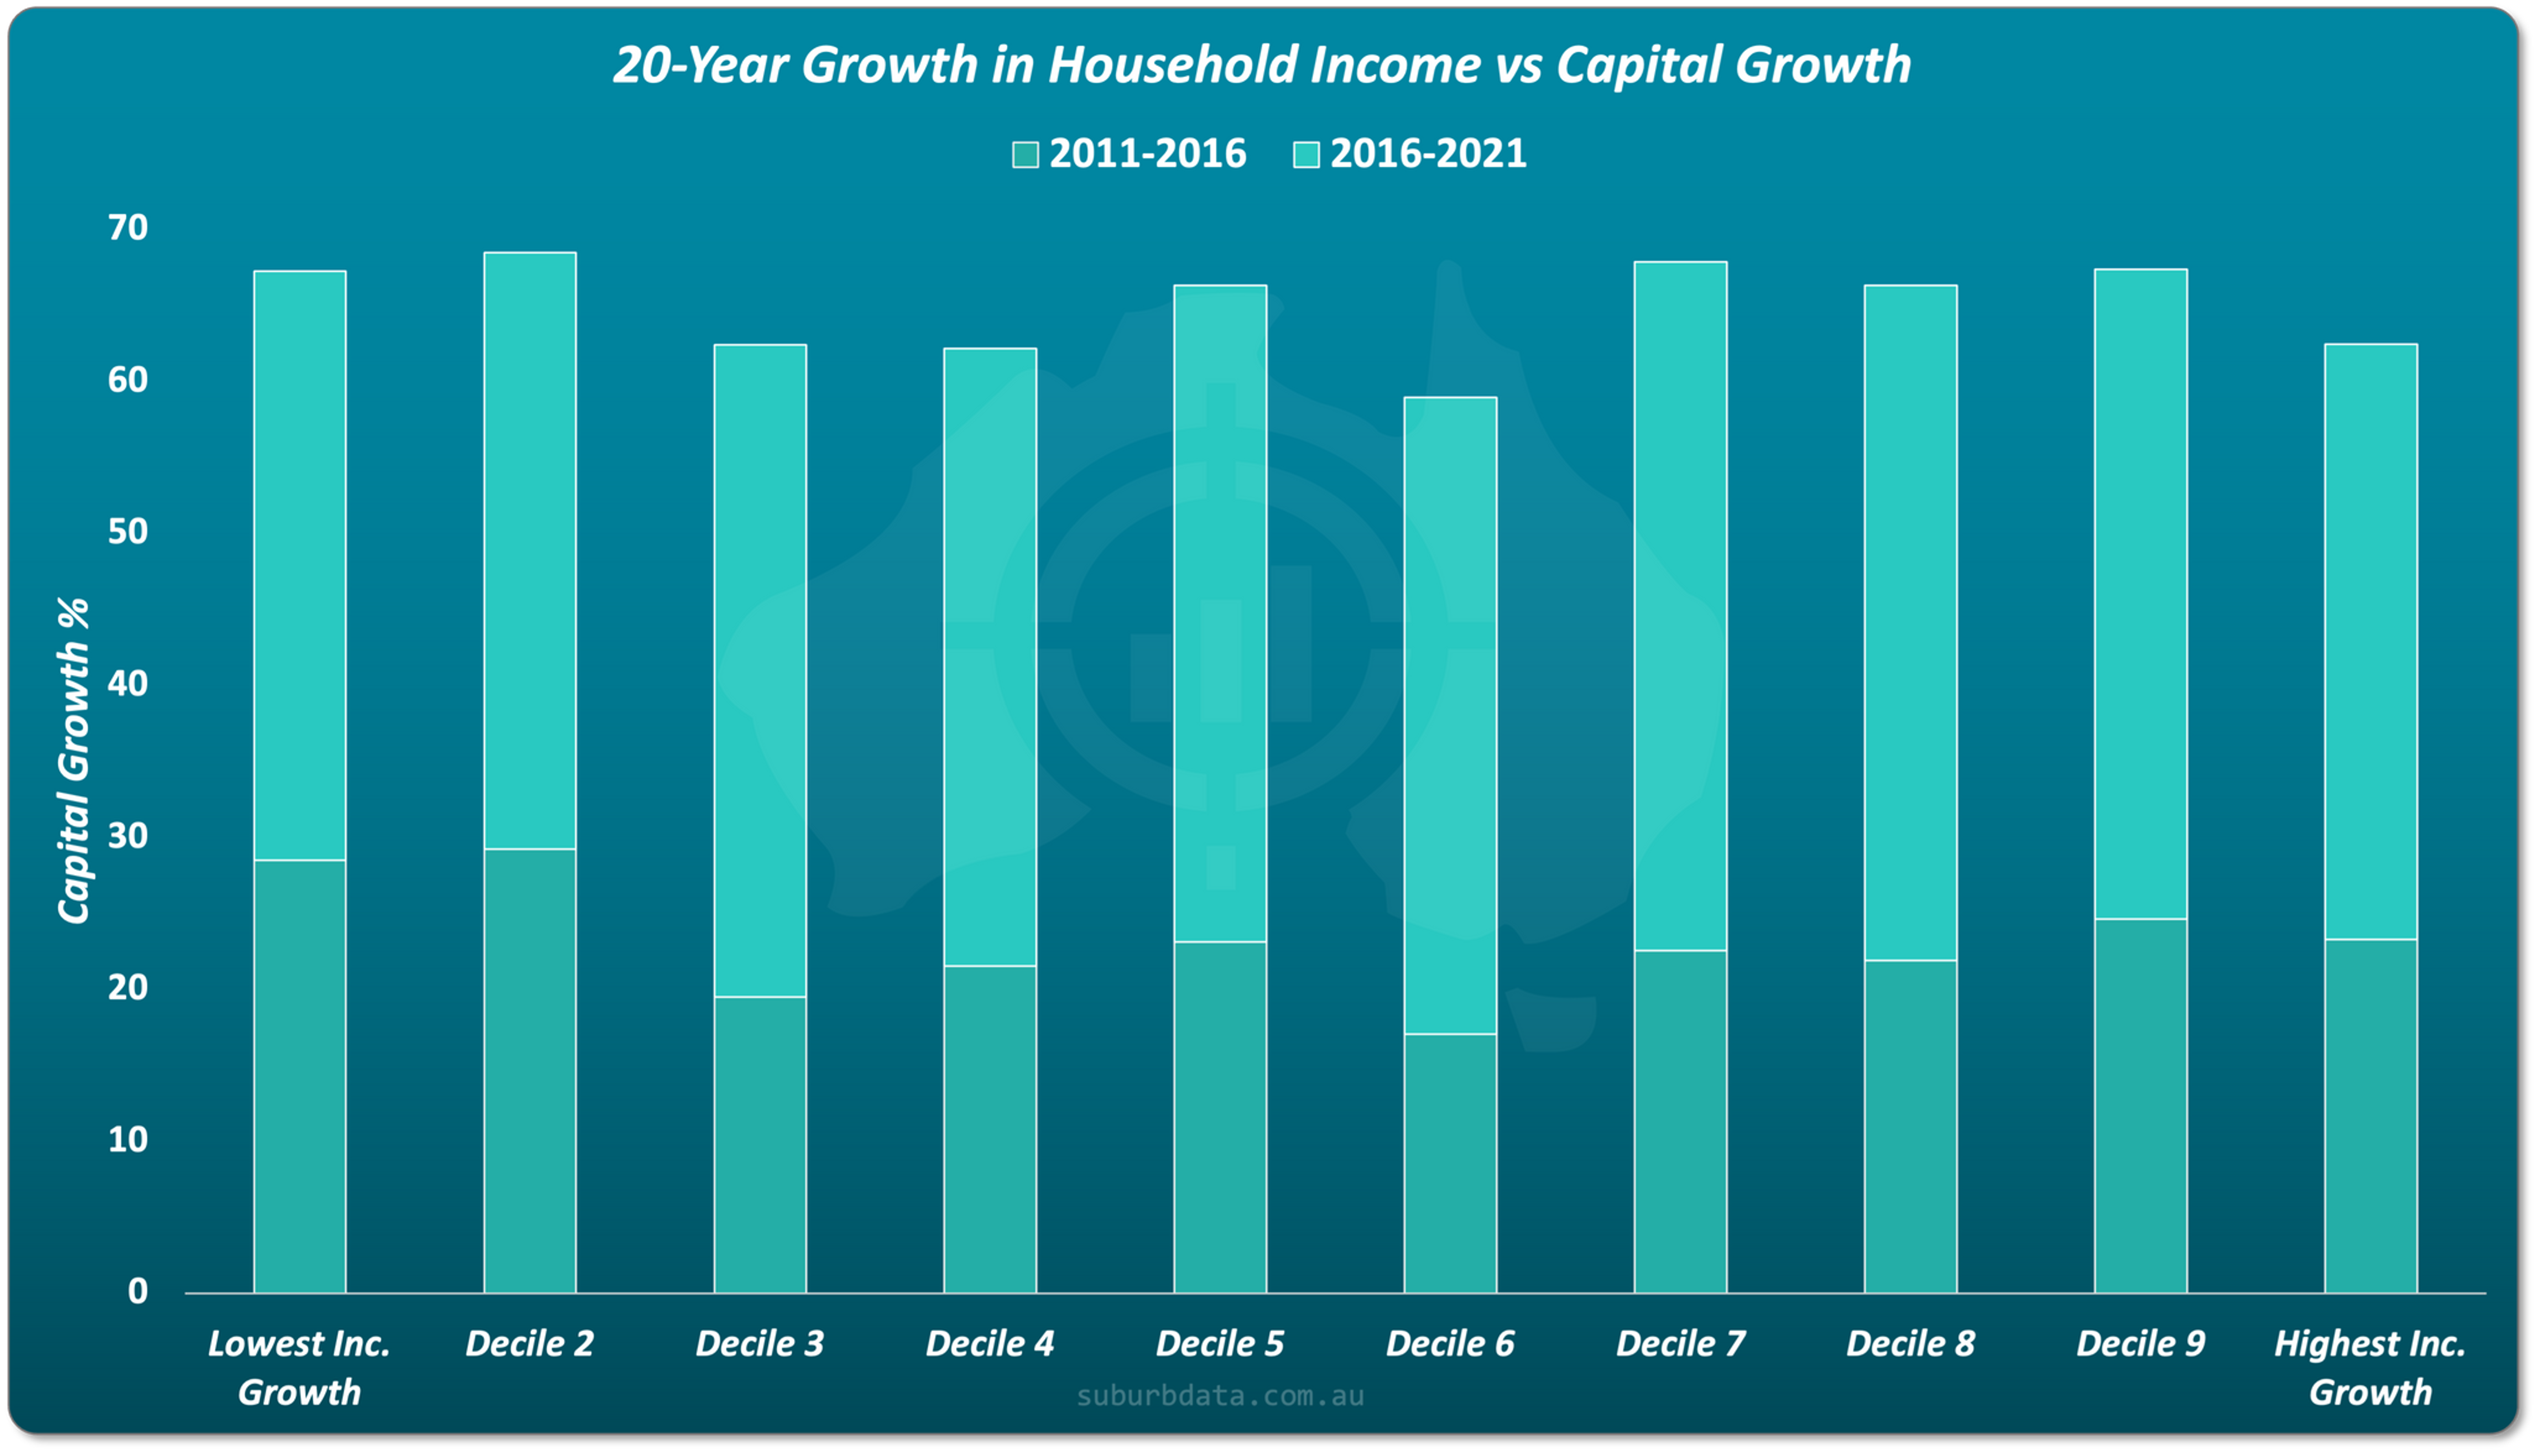
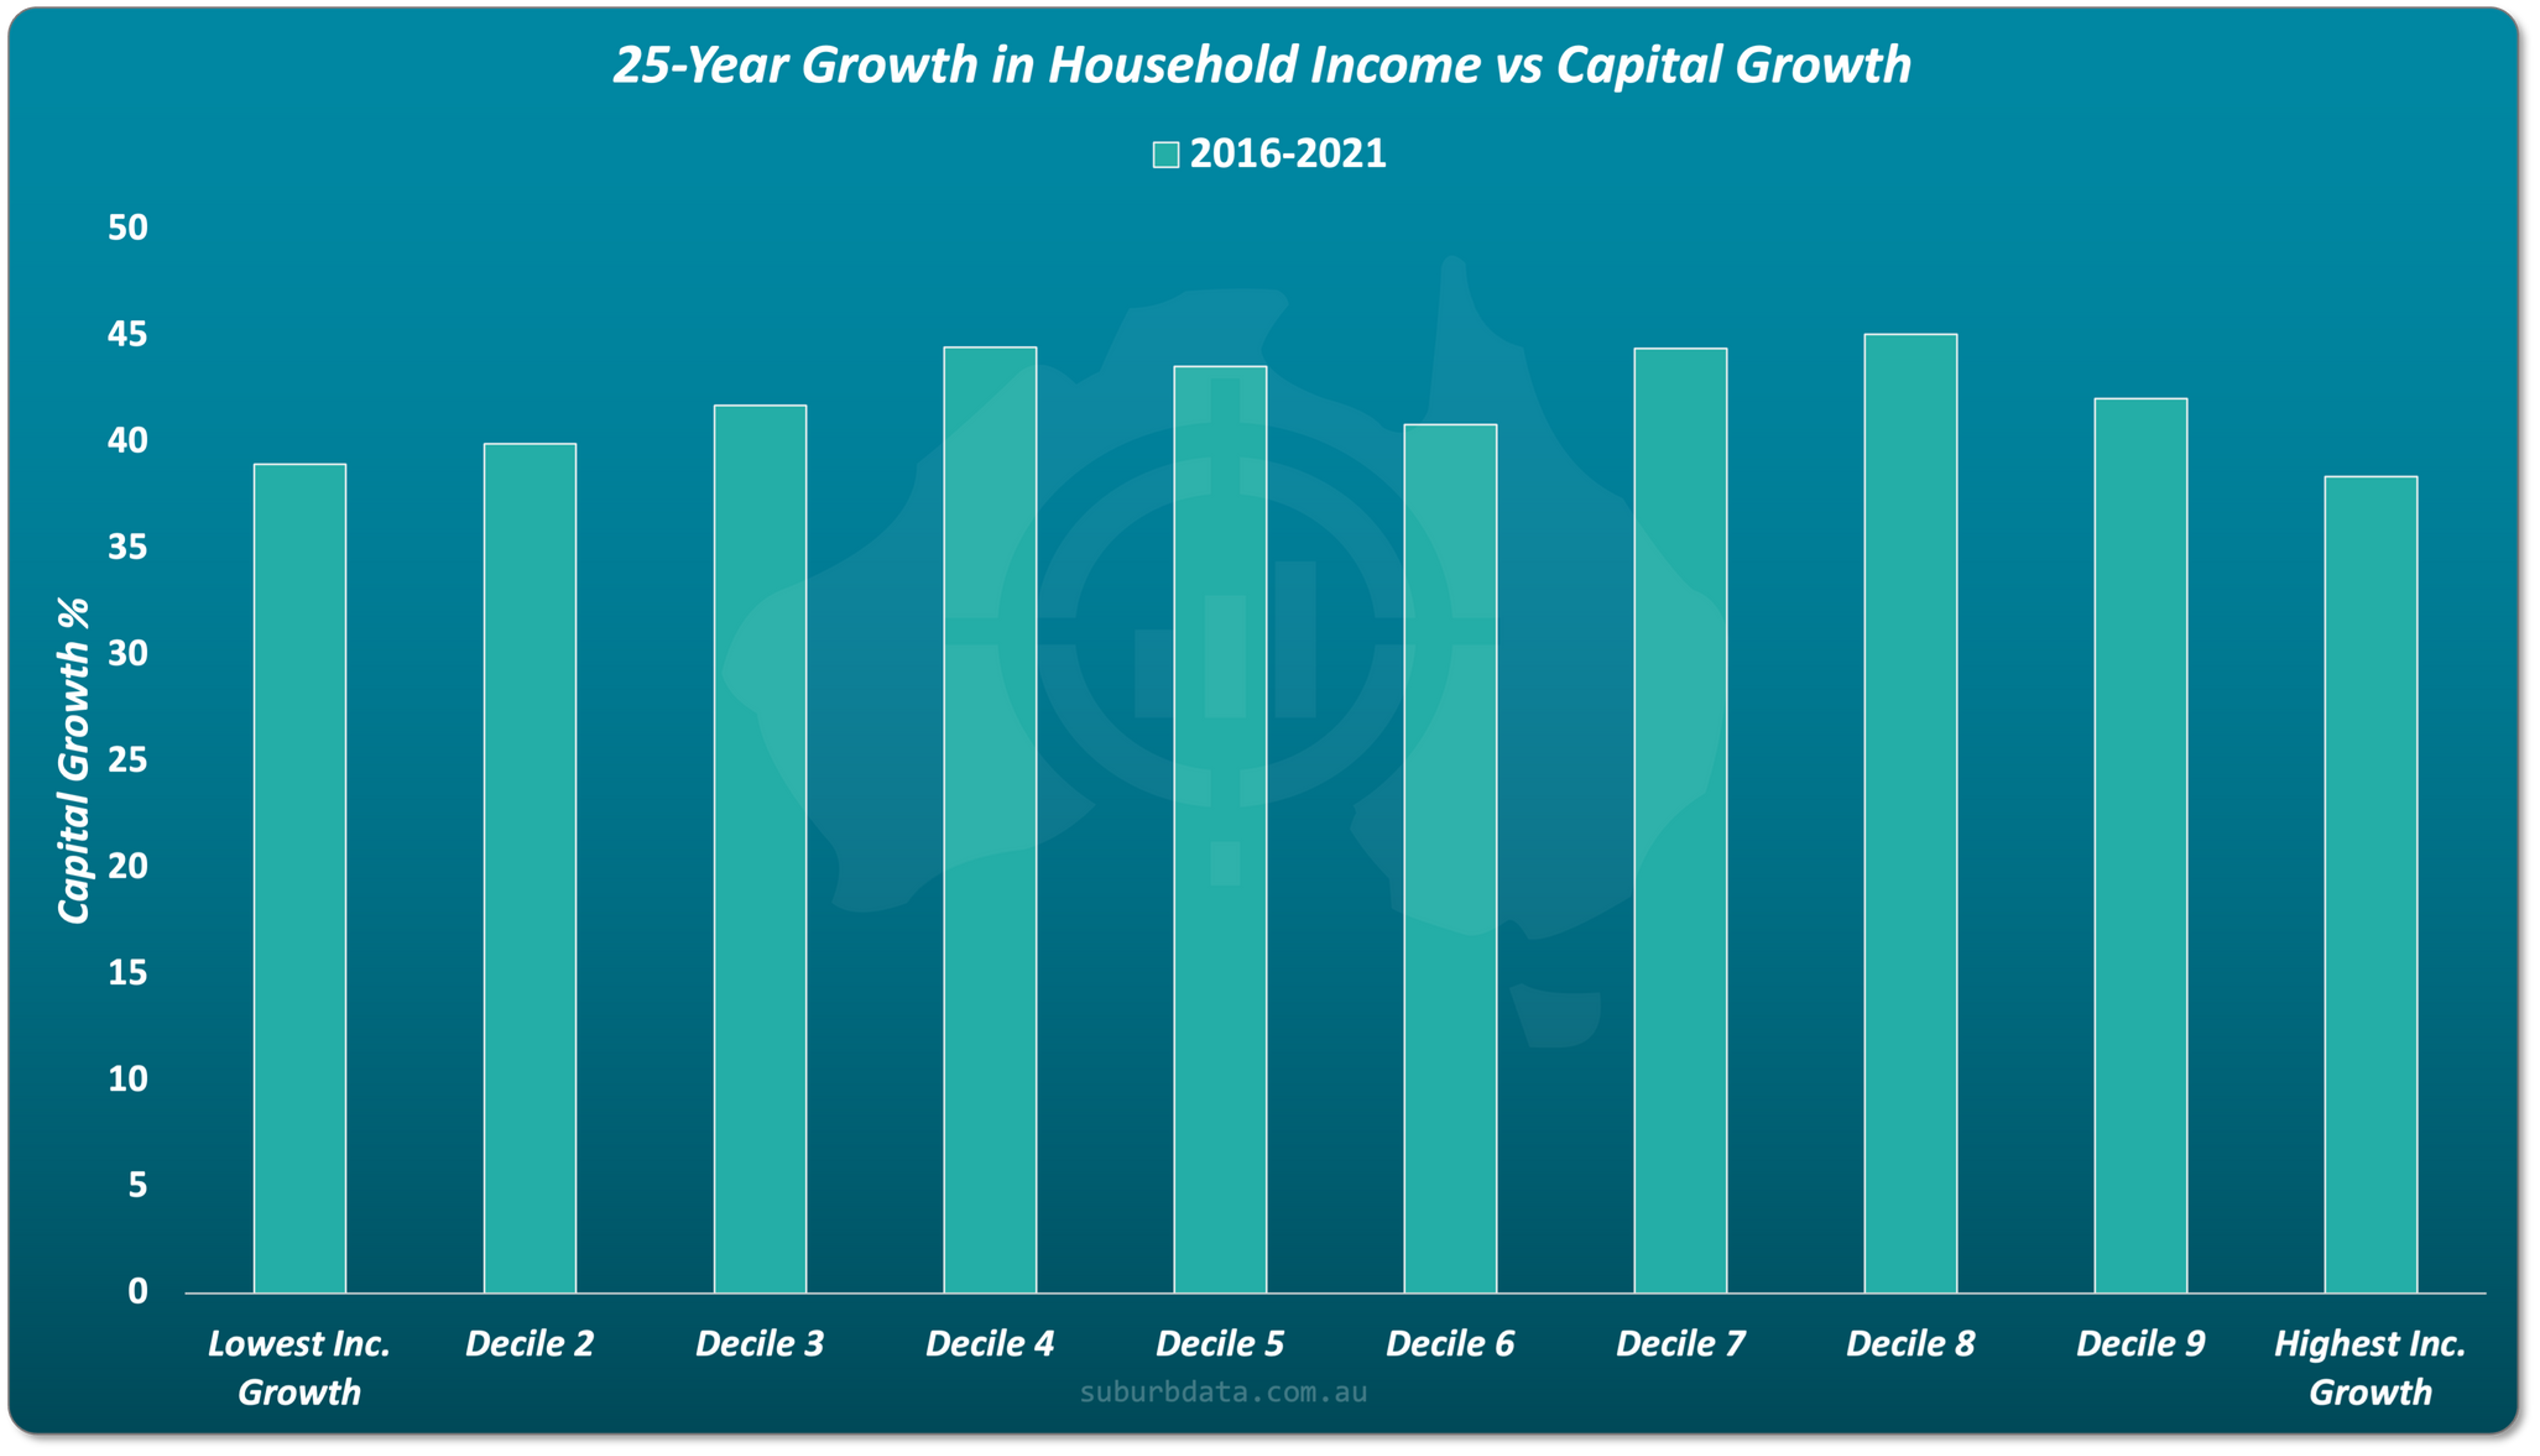
Longer Income Growth Timeframes
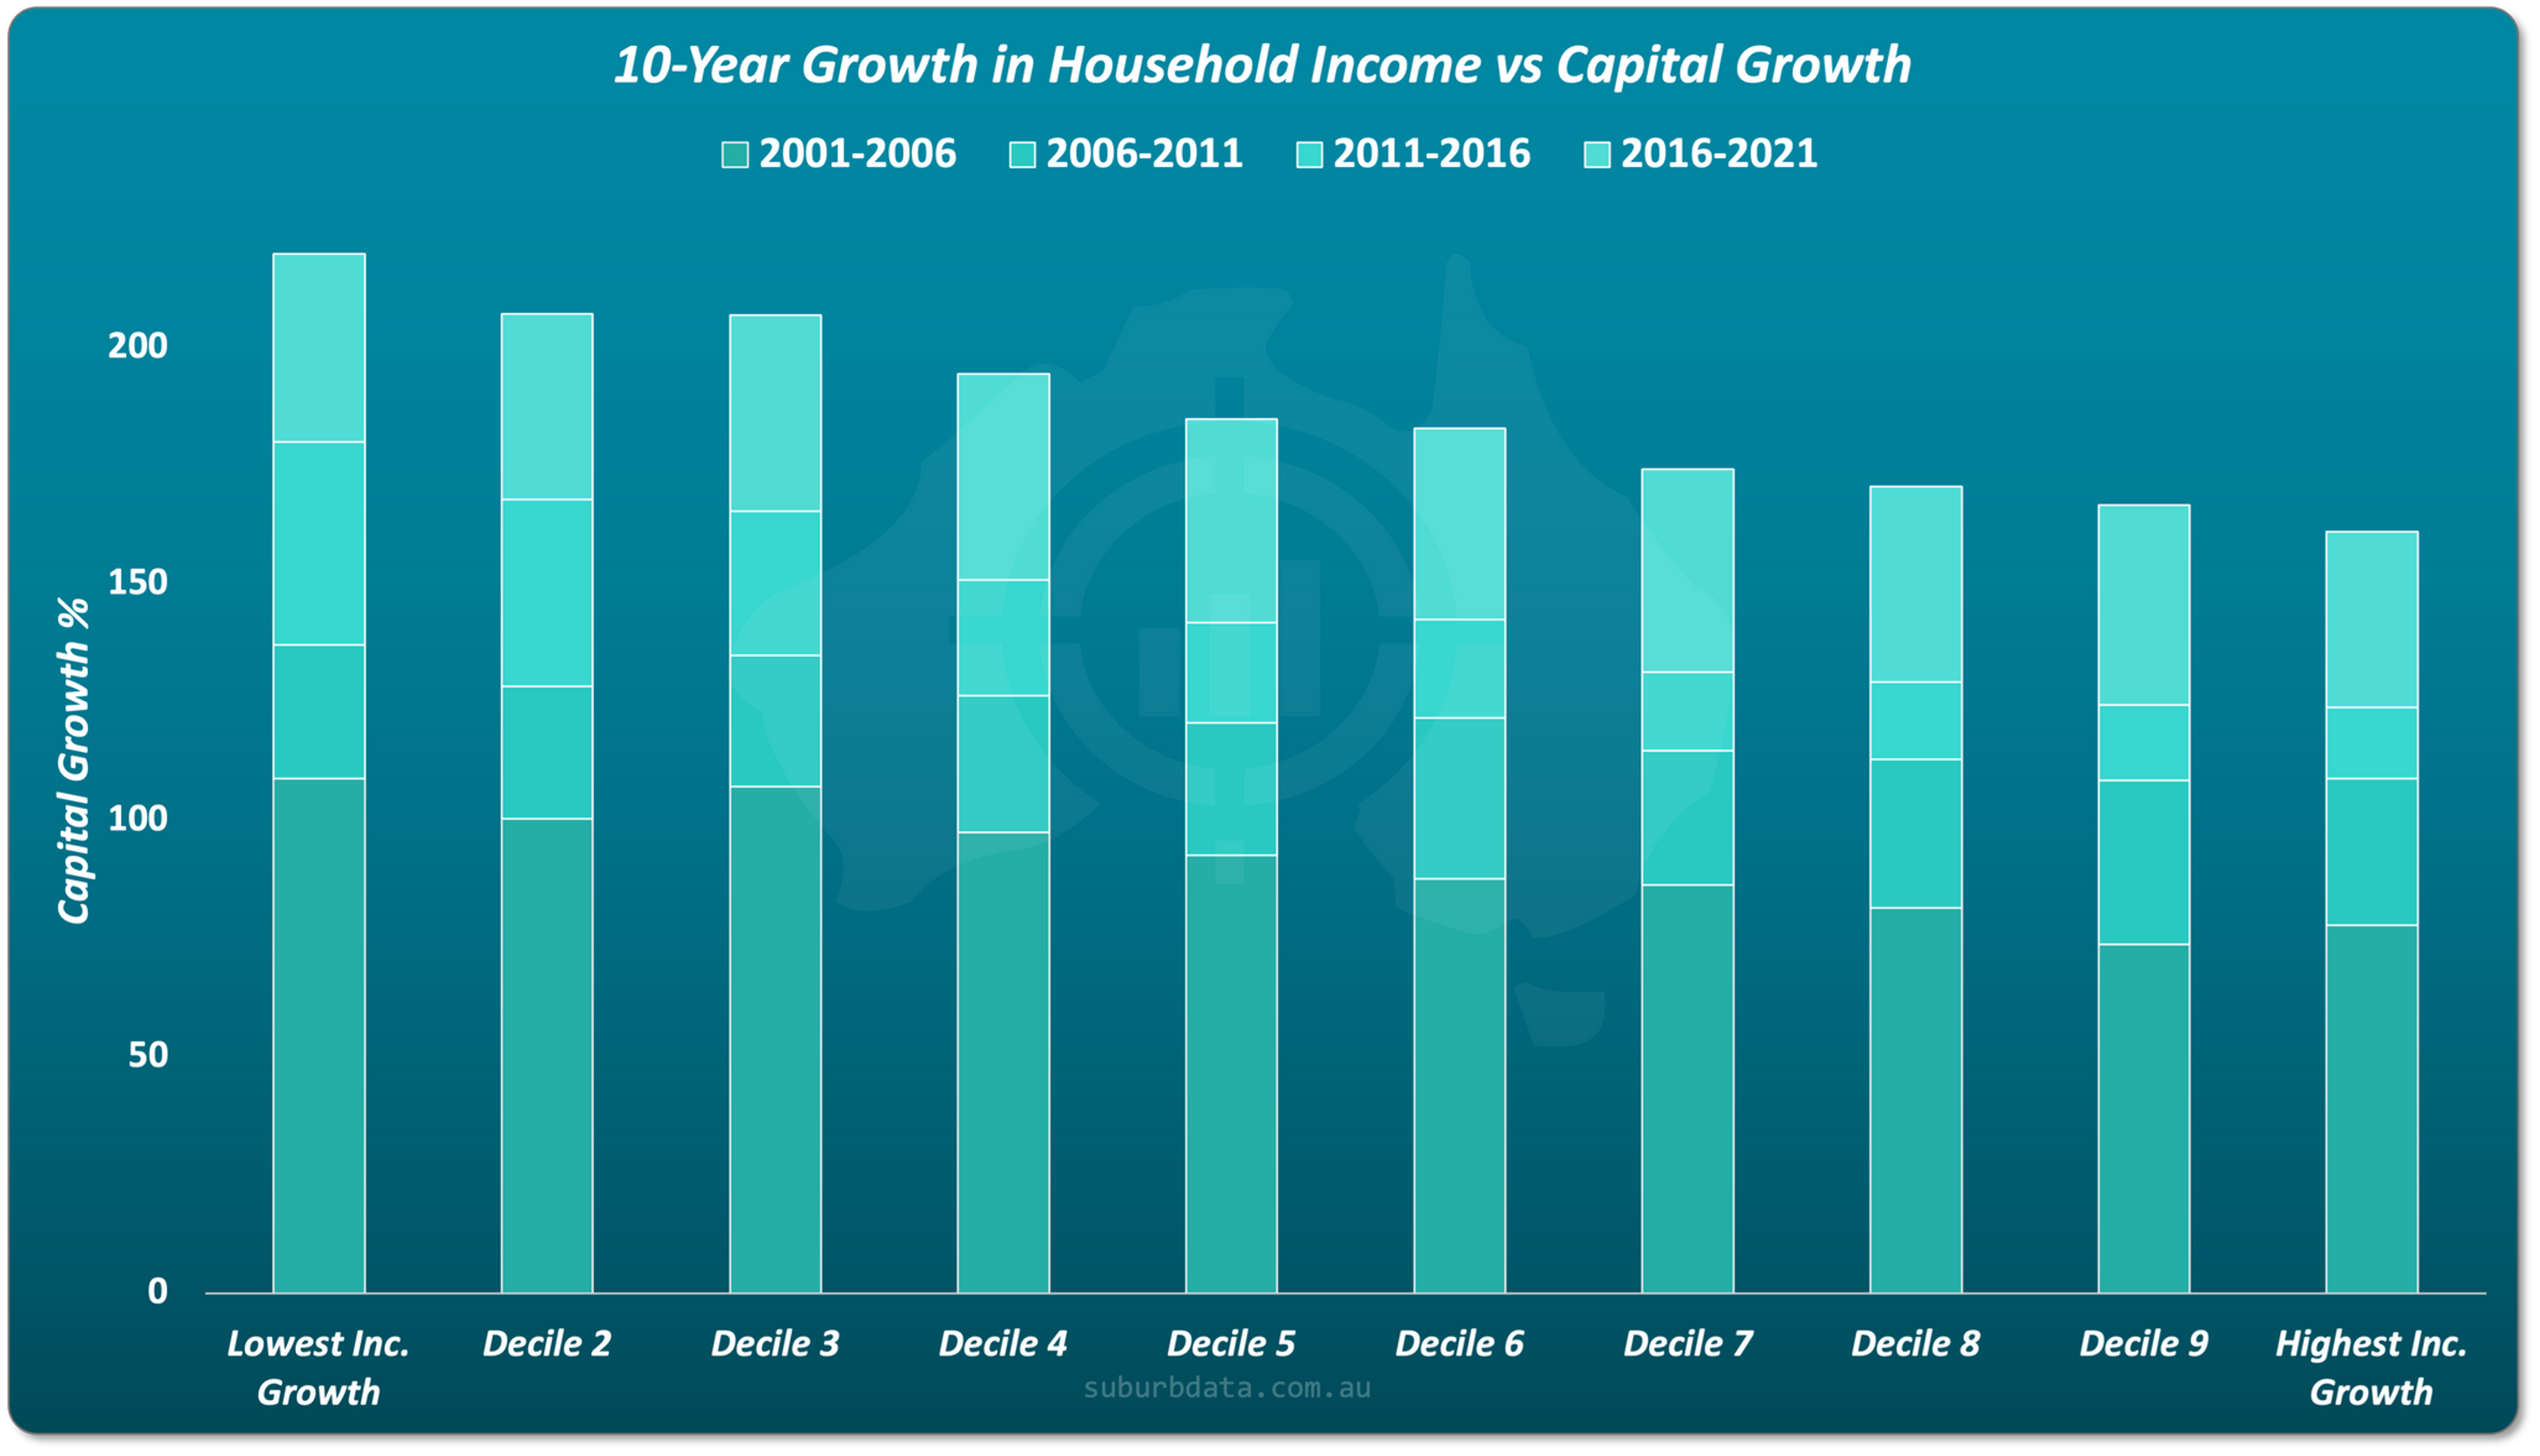
The timeframe was extended to remove short-term noise.
At 10 years, a mild pattern appears, but it actually favours lower income growth suburbs.
Income Relative to the State Average
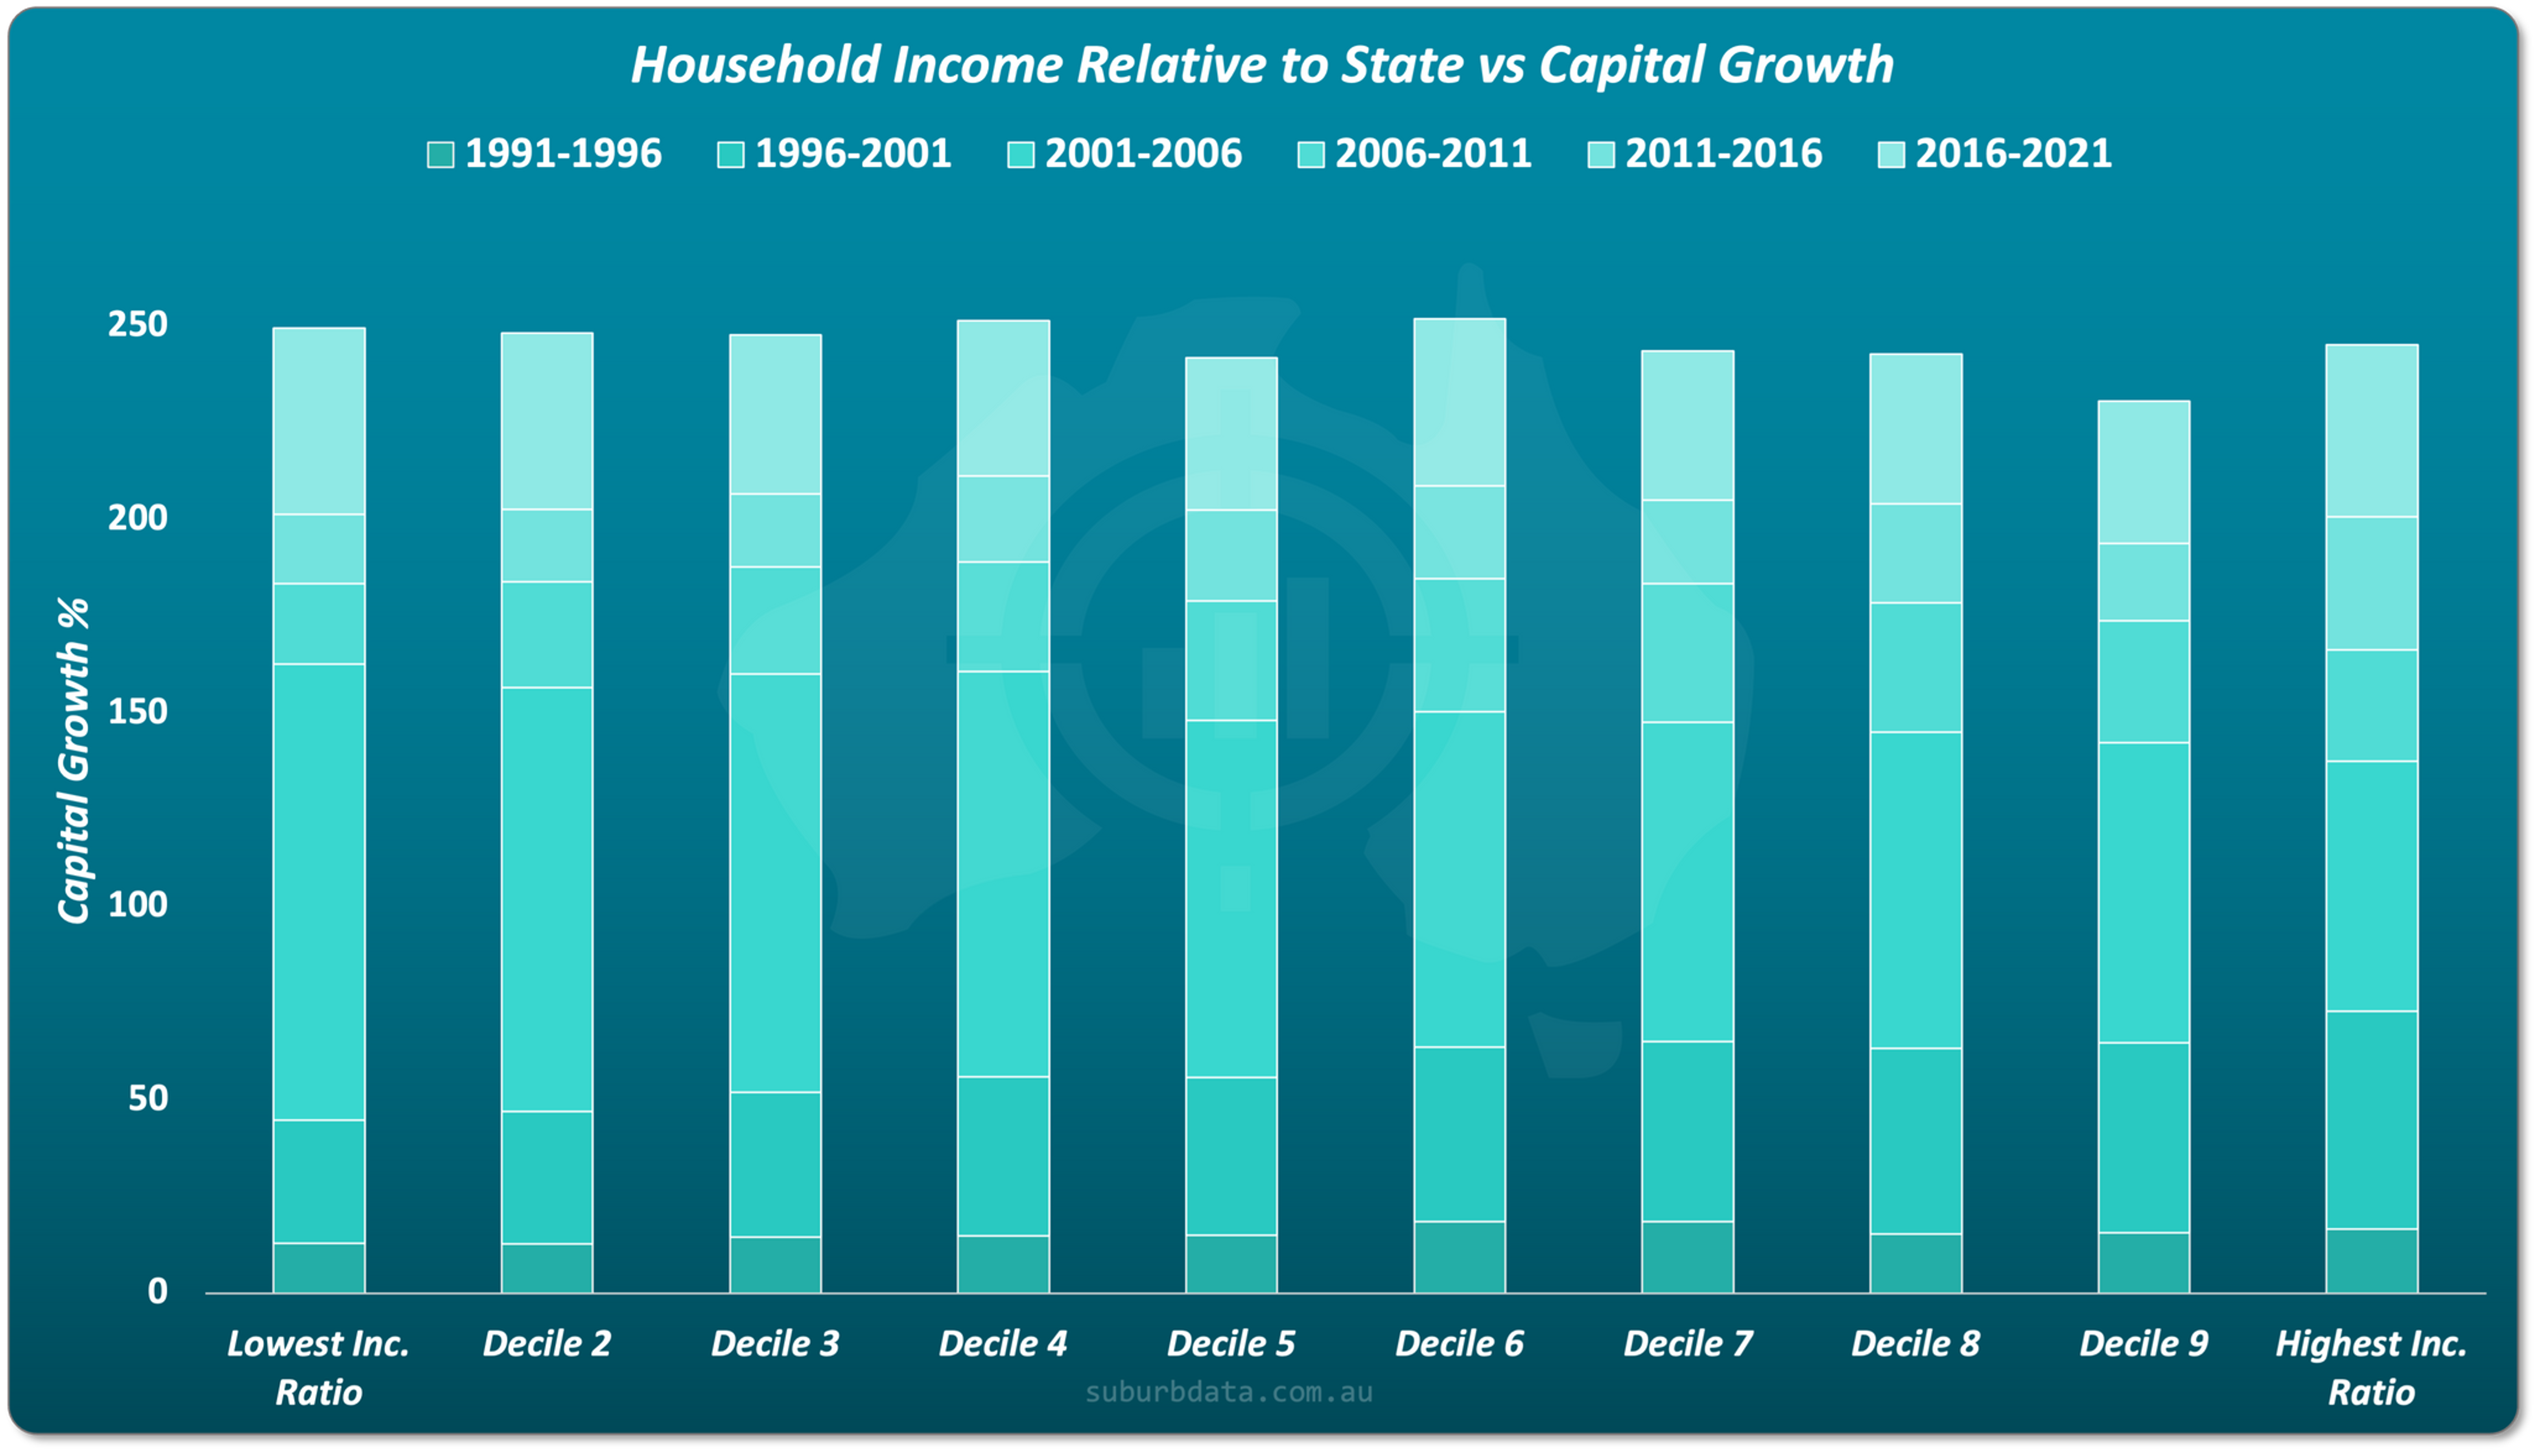
Another variation claims income relative to the state average is what matters.
Instead of asking how much income grew, the question becomes how much faster a suburb’s income grew compared to its state.
This was tested using the same decile framework.
Once again, the result is the same.
Some eras favour higher relative income suburbs. Other eras favour lower.
There is no consistent advantage investors can rely on.
Correlation Does Not Mean Causation
Even if a relationship appeared, it would not prove cause.
Consider this sequence.
Prices rise due to gentrification, or supply constraints Higher prices exclude lower income buyers Higher income households replace them Census data later records higher incomes
In this case, capital growth causes income growth, not the other way around.
And because census data is collected every 5 years, the order cannot be reliably determined anyway.
But it doesn’t matter since there is no correlation to begin with.
Final Conclusion
Income, whether measured as income level, income growth, income growth over 5 to 25 years, or income relative to the state average, does not influence capital growth in a meaningful or repeatable way.
This makes income a weak input for data-driven property investing.
It sounds logical. It feels intuitive.
But decades of Australian property data show it does not work.
That is why income is not used in the Demand to Supply Ratio.
It does not improve suburb selection. It does not improve outcomes.