

Many property advisors say, “Buy and hold” because property is a long-term investment. Be patient.
The logic sounds simple. If you hold long enough, the market will reward you.
But this belief is not supported by the data.
When you zoom out, a very different pattern emerges. Short-term winners plateau. Other markets catch up. The gap closes.
The fastest path to financial freedom through residential property is not one long hold. It is a series of well-chosen short ones. This article shows why.
The Question Nobody Asks
Two markets. Both start at $500,000.
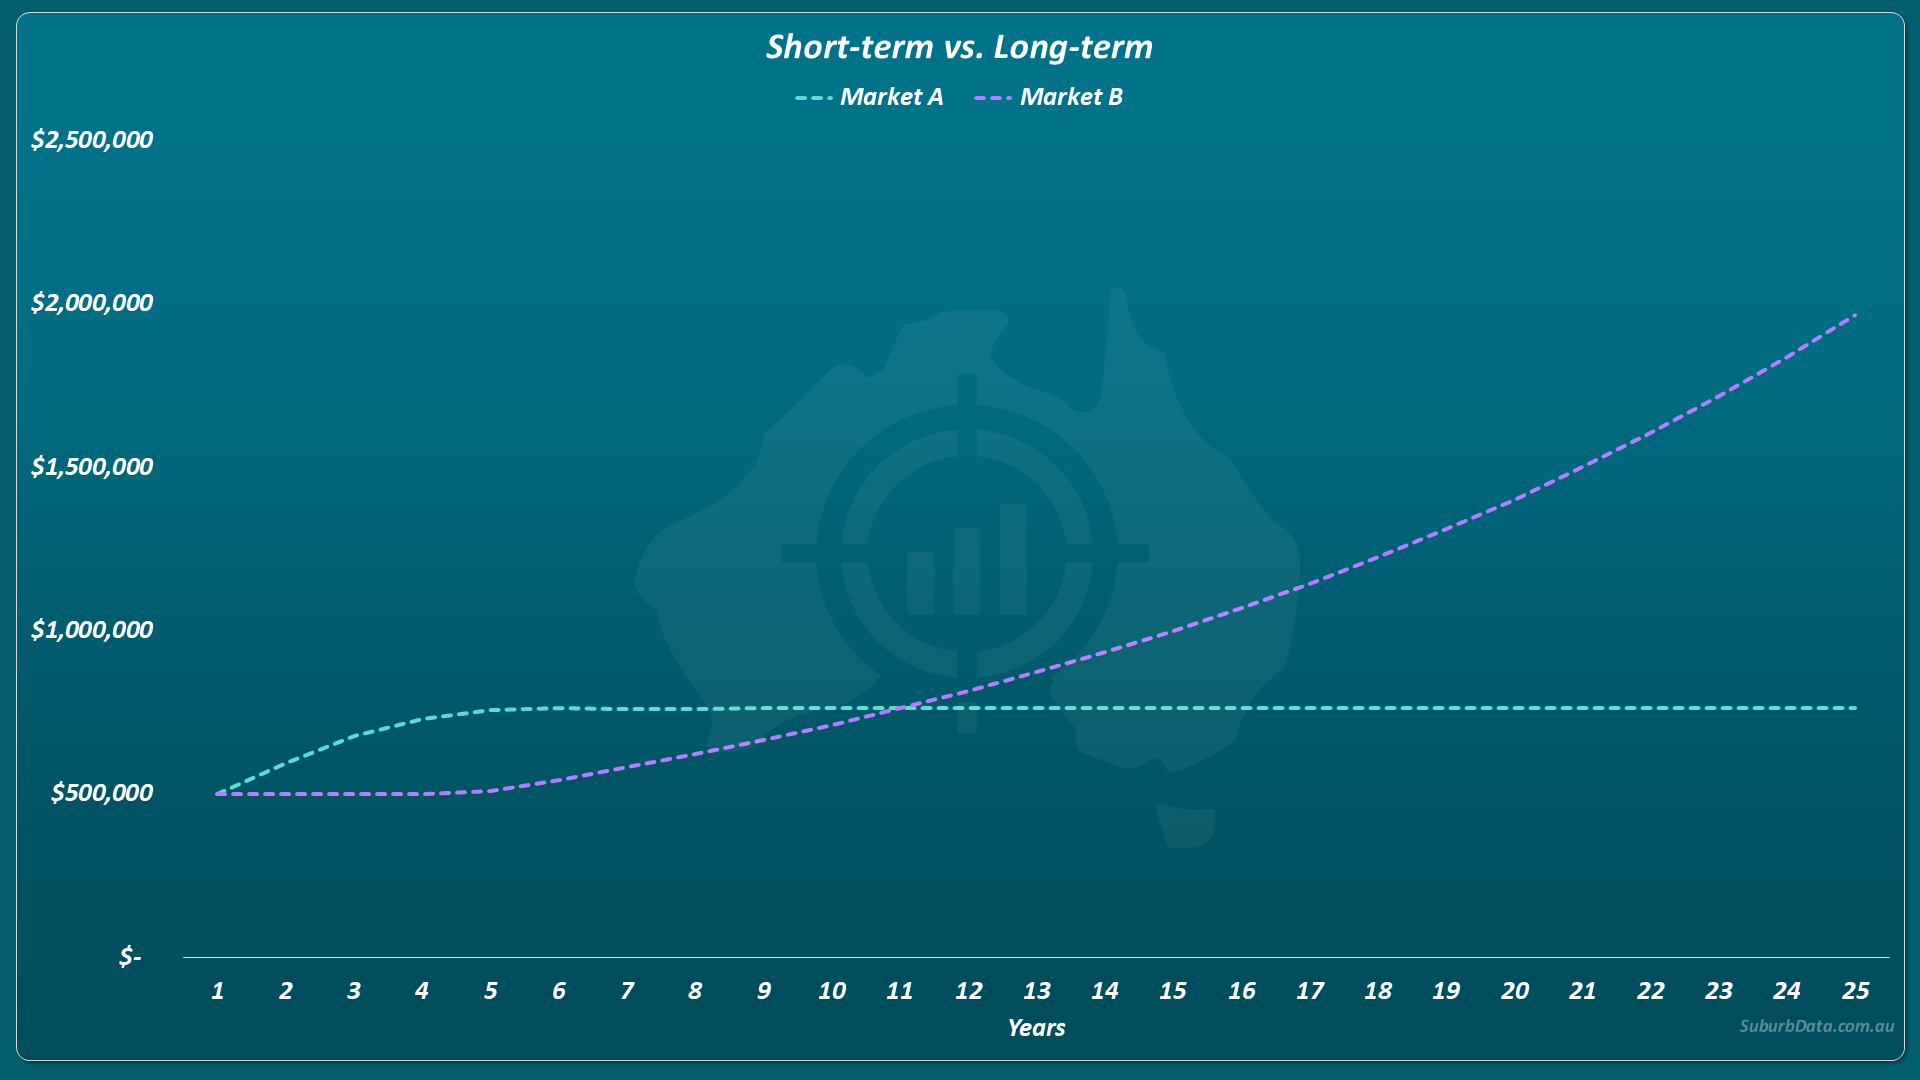
Market A grows 50% in the first 5 years. Then flat for 20 years.
Market B is flat for 5 years. Then grows 300% over the next 20.
Which do you pick?
Most say Market B. More total growth. Longer runway.
The correct answer is Market A.
Before looking at why, consider the chart below. It shows both markets playing out over 25 years. Market A in turquoise gets off to a strong start but flattens early. Market B in purple starts slow but accelerates over the long run.
At first glance, Market B looks like the obvious choice. But that instinct is wrong. Here is why.
Why Market A Wins
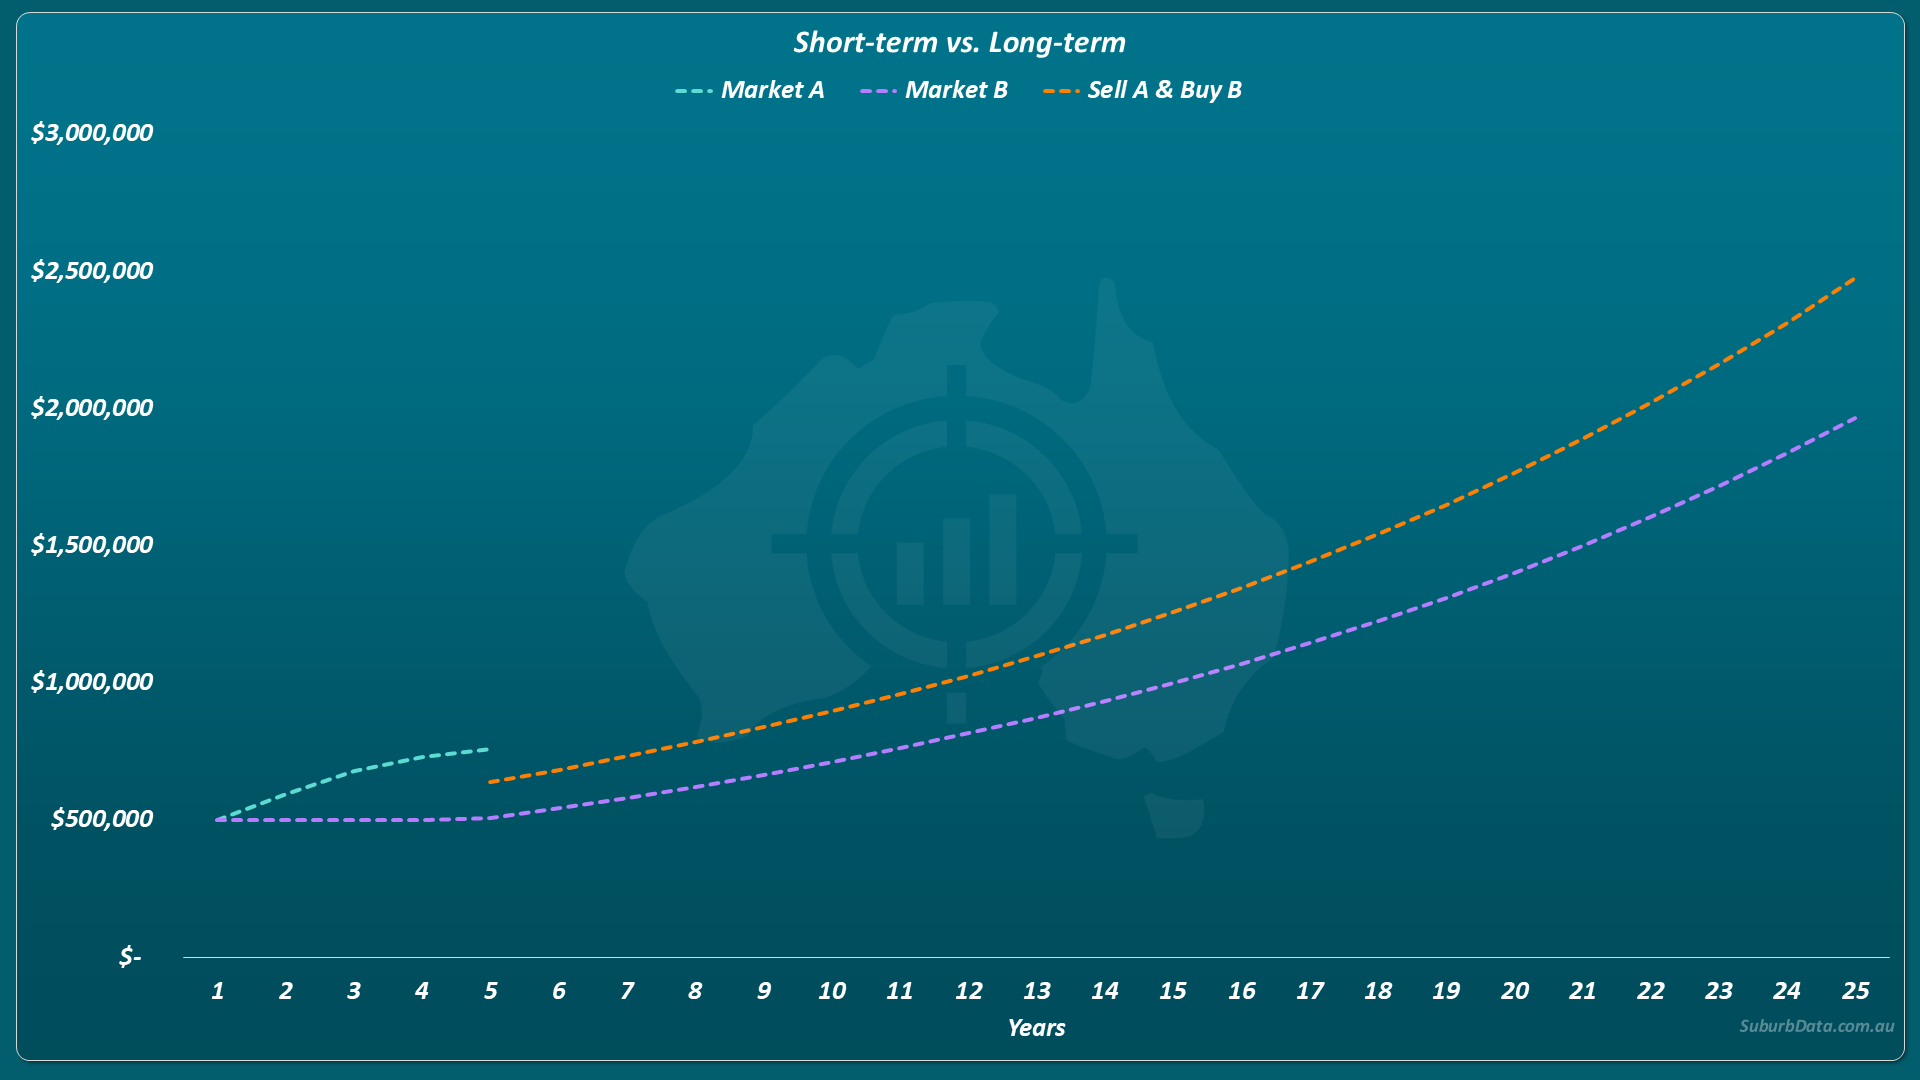
After 5 years in Market A, you sell. You pay the costs. Then you reinvest into Market B with more capital than you started with.
You captured 50% growth first. You enter Market B with a larger base. The investor who held Market B from year zero never catches up.
The chart below shows all three paths. The orange line is the key one. It starts where Market A ends at year 5. Watch where it finishes compared to the purple line.
Trading Property: The Two Real Problems
This strategy has two obstacles.
Exit and re-entry costs. Selling (exiting) costs money. Agent commission, capital gains tax, legal fees. Buying (entering) costs money too. Stamp duty, legal fees, inspections. These are real and they hurt.
Growth forecasting. The example assumes you know the future. Nobody does with certainty. But short-term forecasting is improving every year. Data and AI are making it increasingly reliable.
Short-Term Outperformance Is Radical. Long-Term Is Not.
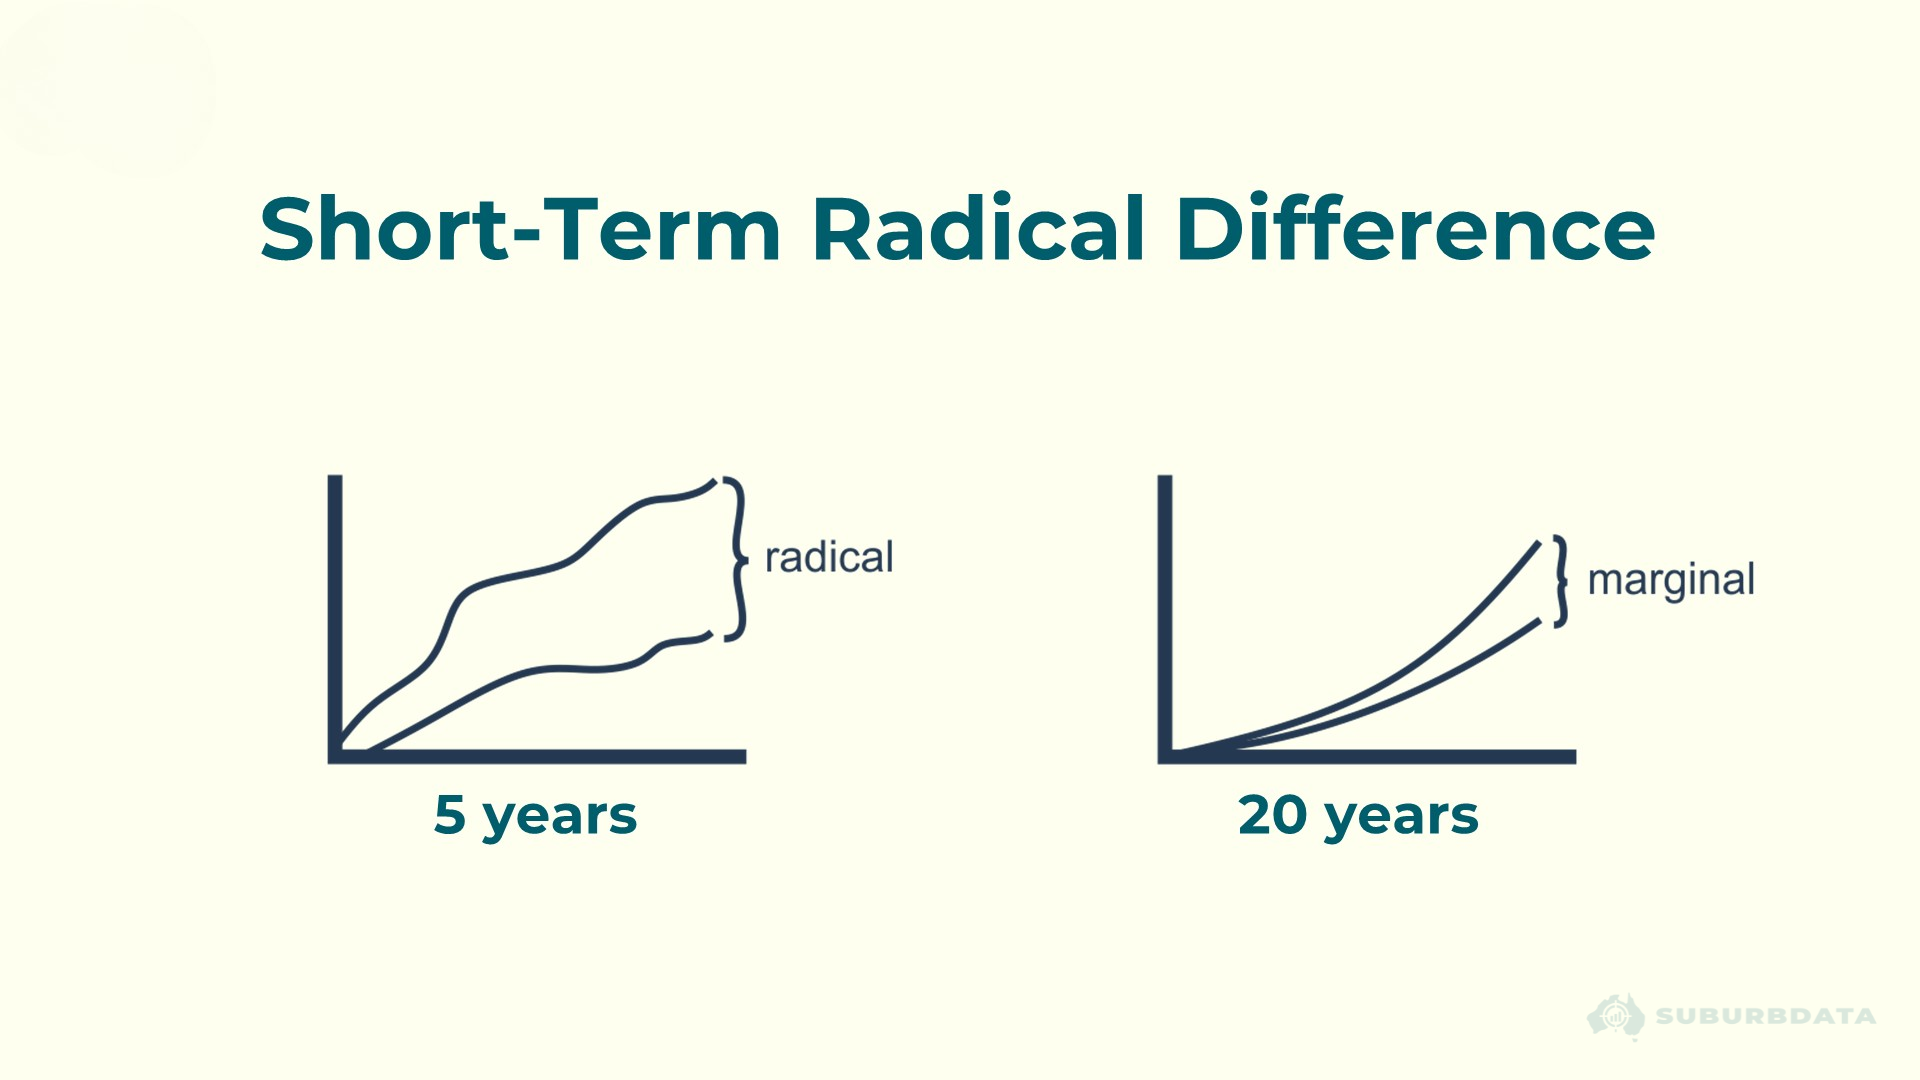
Over short timeframes, the gap between winners and losers is phenomenal. One market grows 50%. Another grows 5%. Over 3 to 4 years, that is a ten-fold difference.
Over 20 years, that gap shrinks to almost nothing.
The reason is the Apples and Oranges effect covered in episode 11 of this Expert Busting Series. A suburb that grows far above average over the long-term becomes absurdly expensive relative to alternatives. Demand shifts to cheaper options. That shift in demand helps the more affordable options catch up. As a result, all property markets tend to grow at the same rate over the long-term.
The diagram below shows short-term versus long-term growth differences between 2 markets. Look at the spread between the lines over 5 years on the left. Then look at the same spread over 20 years on the right.
This is why short-term outperformance is where the odds are in your favour:
- One market outperforming by 50% over 5 years: possible
- One market outperforming by 300% over 20 years: unlikely
Most Long-Term Outperformers Are Not What They Seem
Look at any suburb labelled a long-term outperformer. Examine the full history.
In most cases, the outperformance is recent.
The suburb may have tracked the national average for decades. Then it surged in the last 5 years. The compound effect of that recent surge makes the 30-year chart look impressive. These are not long-term outperformers. They are short-term outperformers that outperformed recently.
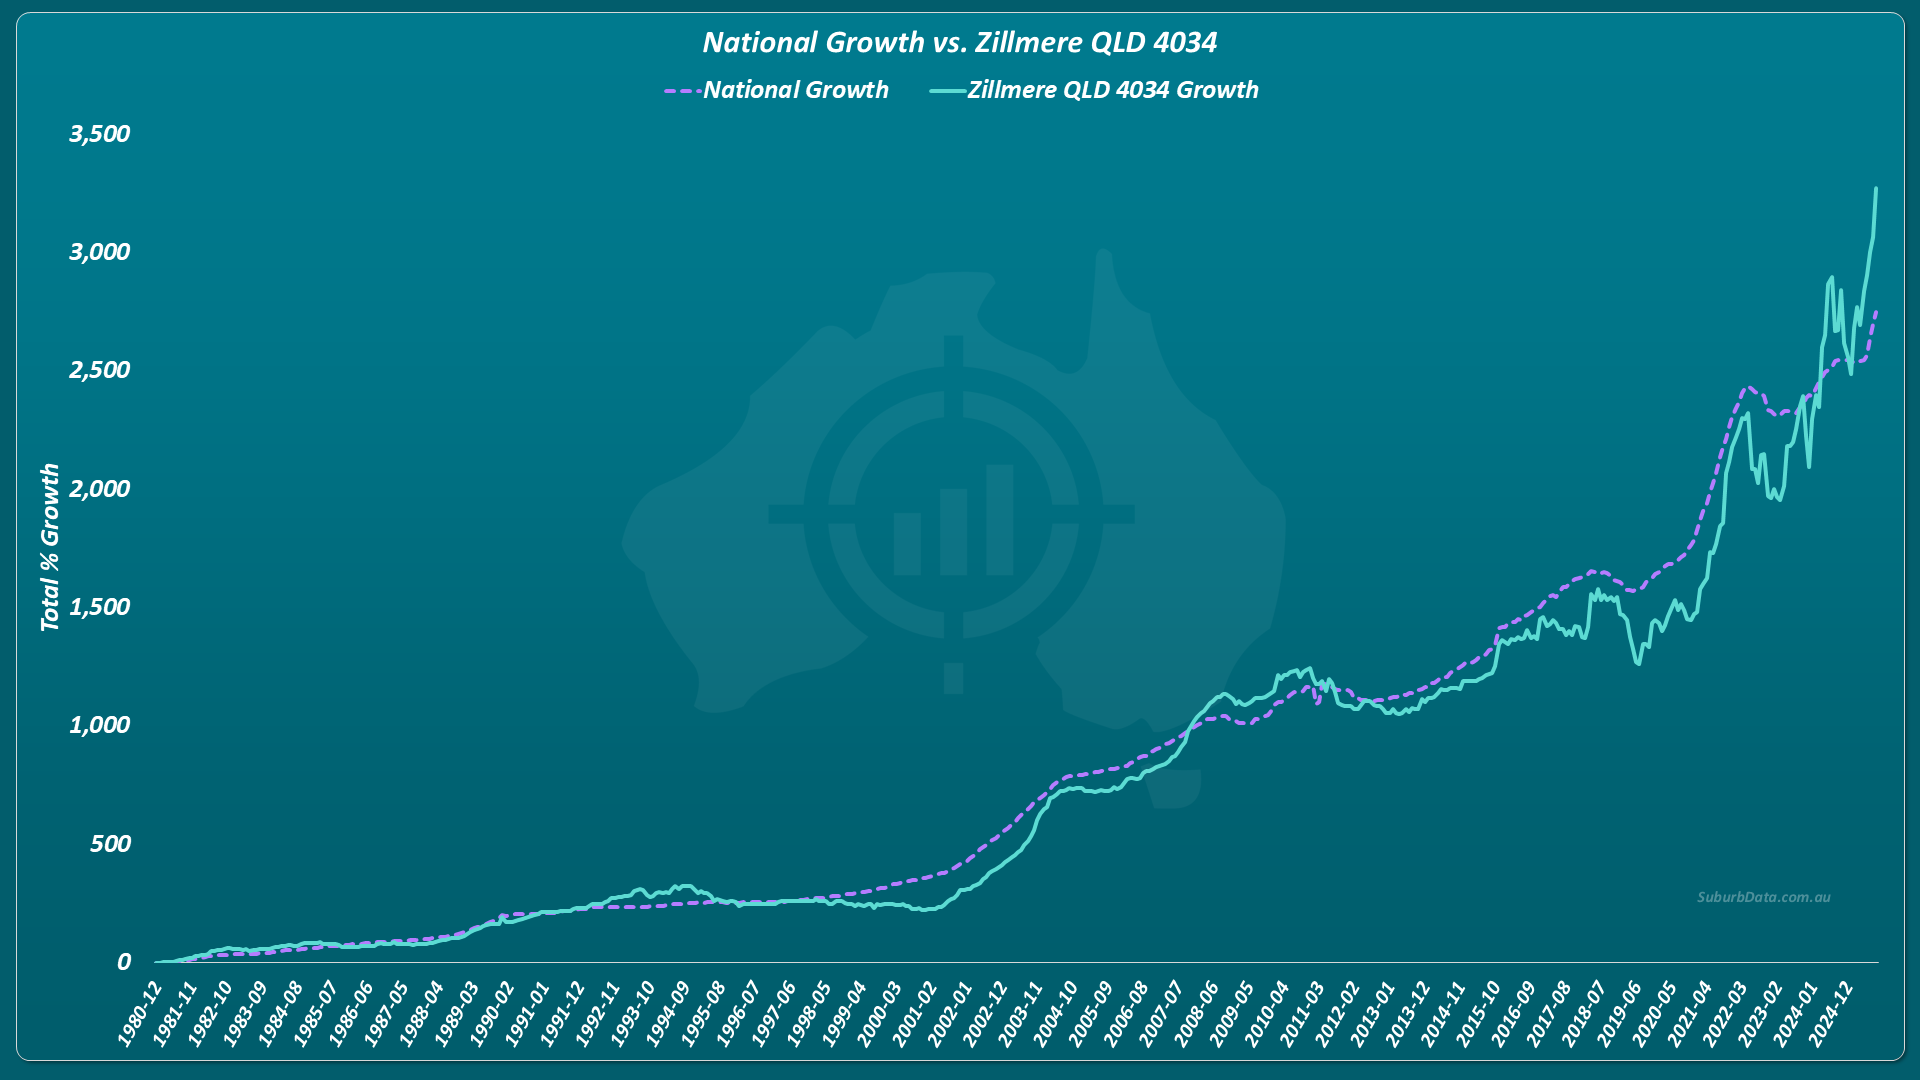
Zillmere in Brisbane is a clear example. The chart below shows 45 years of growth in Zillmere compared to the national growth rate. Notice how many times the two lines cross before the end. Two years before the end of the chart, Zillmere had virtually the same cumulative growth as the national average. The divergence only appears at the very end.
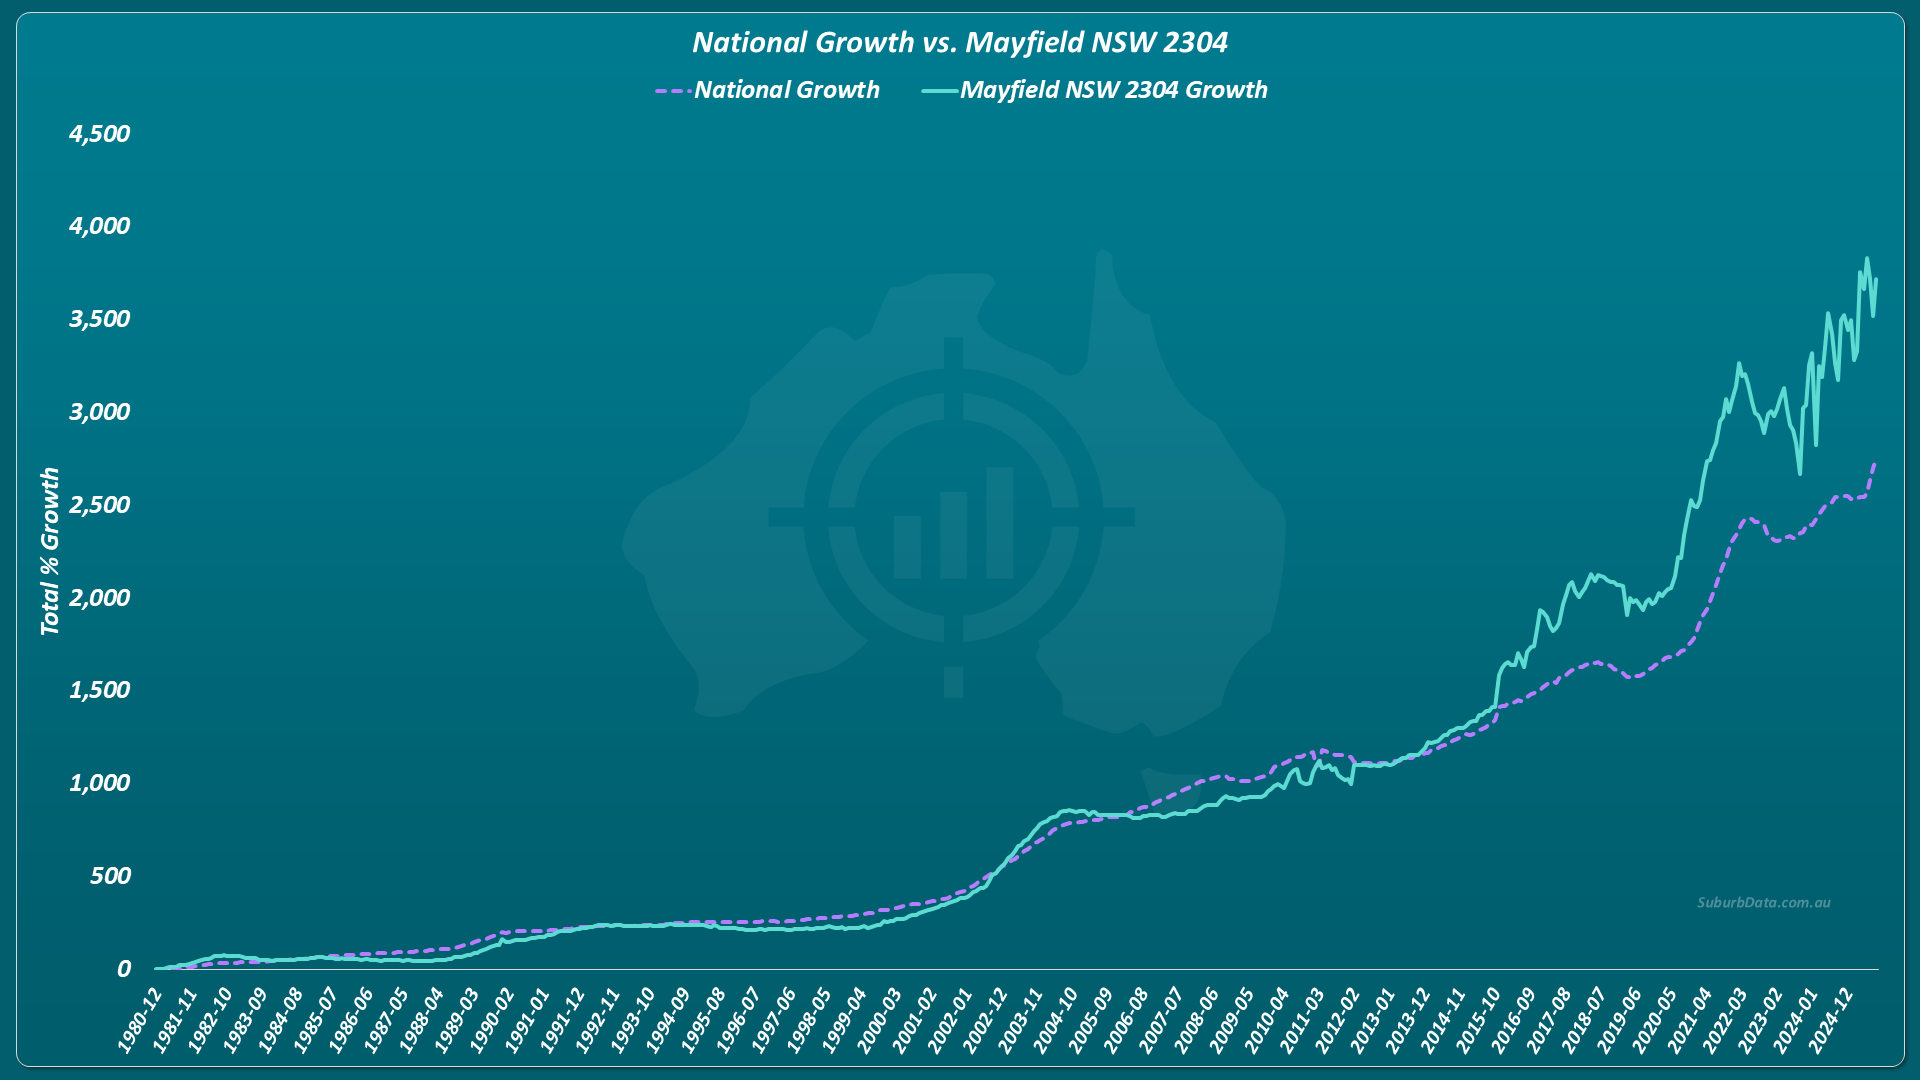
Mayfield in NSW tells the same story. The lines converge multiple times across 45 years. The major divergence only appears in the last decade.
No Market Outperforms Forever
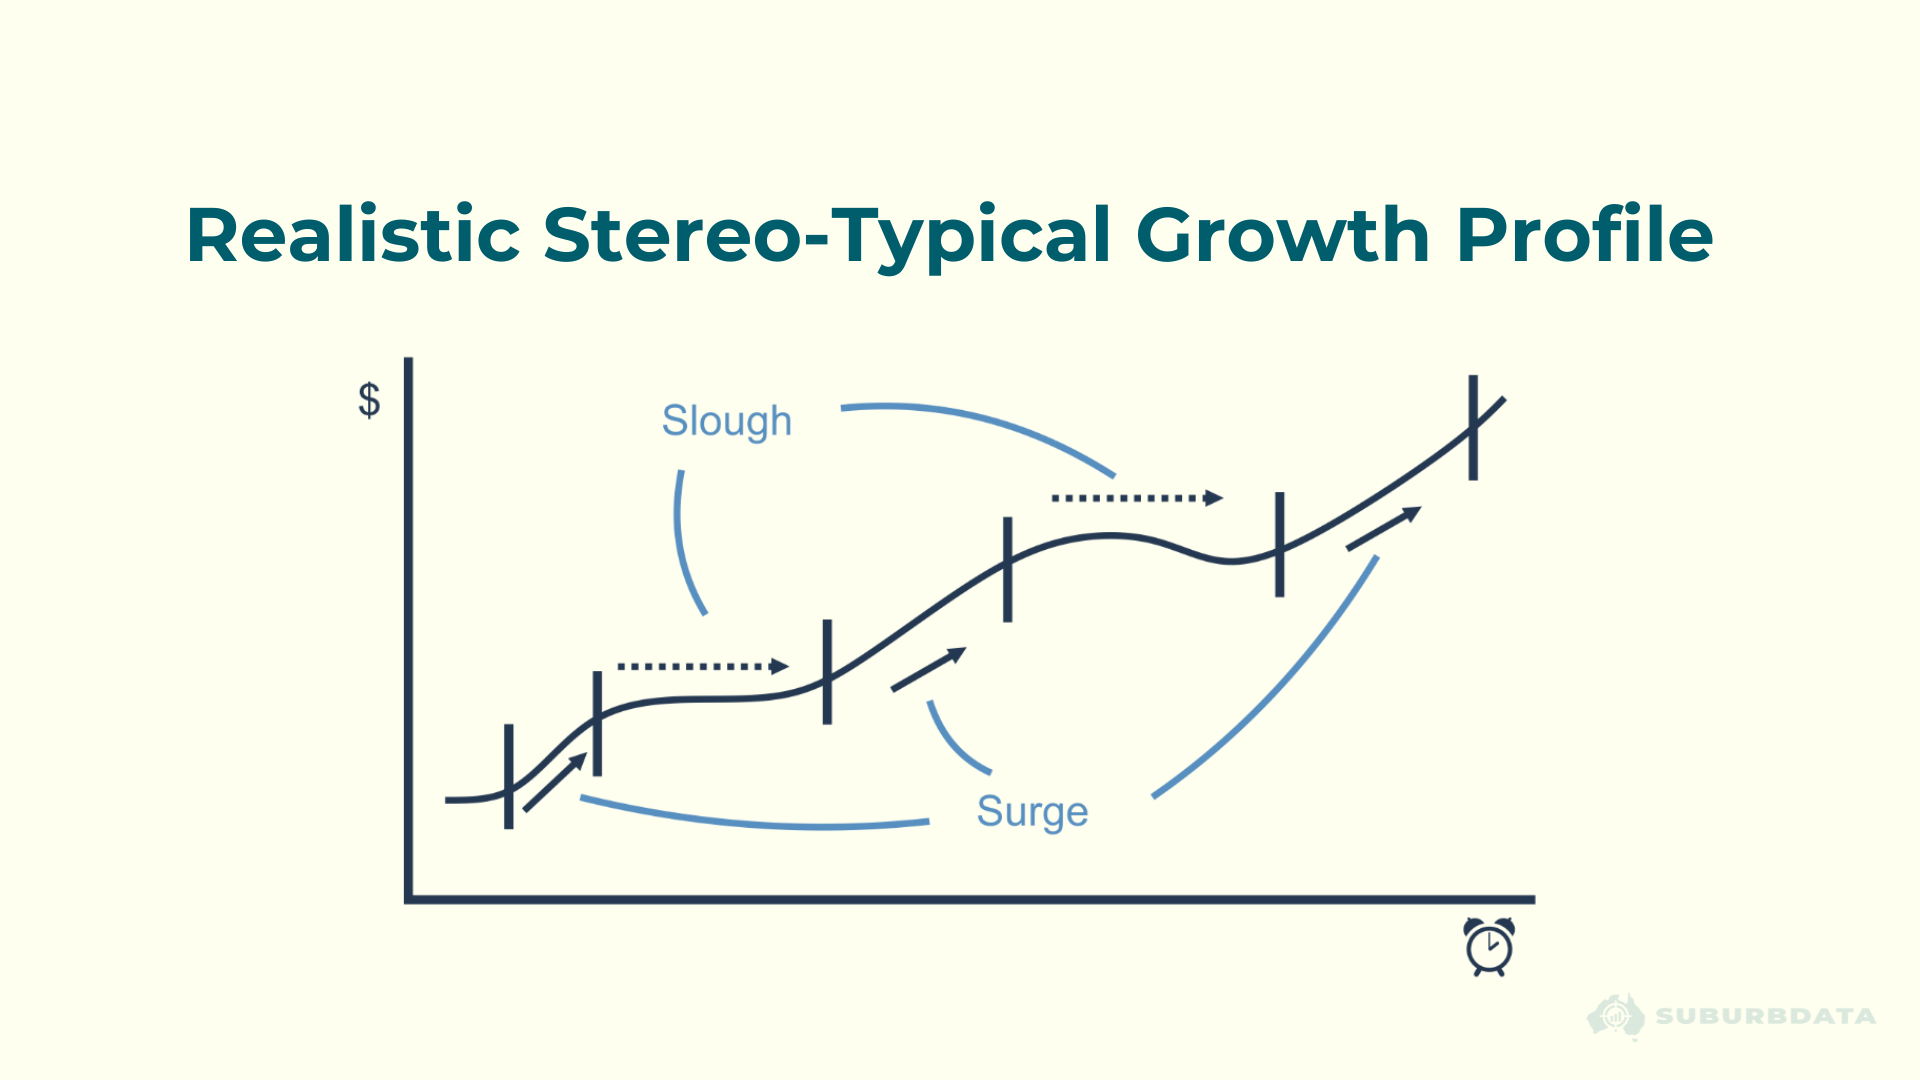
Long-term growth is not a steady climb upward. It is surges followed by flat periods. Then surges again.
That cycle is what allows other markets to catch up and overtake. No market consistently outperforms over 30 or more years. There are eras when a market leads and eras when the same market lags.
The diagram below shows what a realistic long-term growth profile typically looks like. Notice the repeating pattern of surges and sloughs. The space between vertical markers is either a boom or a bust. Either a time to own property in this market or a time to own property elsewhere.
A buy-and-hold investor captures the surge and then holds through the slough. Other markets catch up while they wait.
A short-term investor captures the surge and moves on.
You Learn Faster With a Short-Term Focus
A long-term strategy gives almost no feedback.
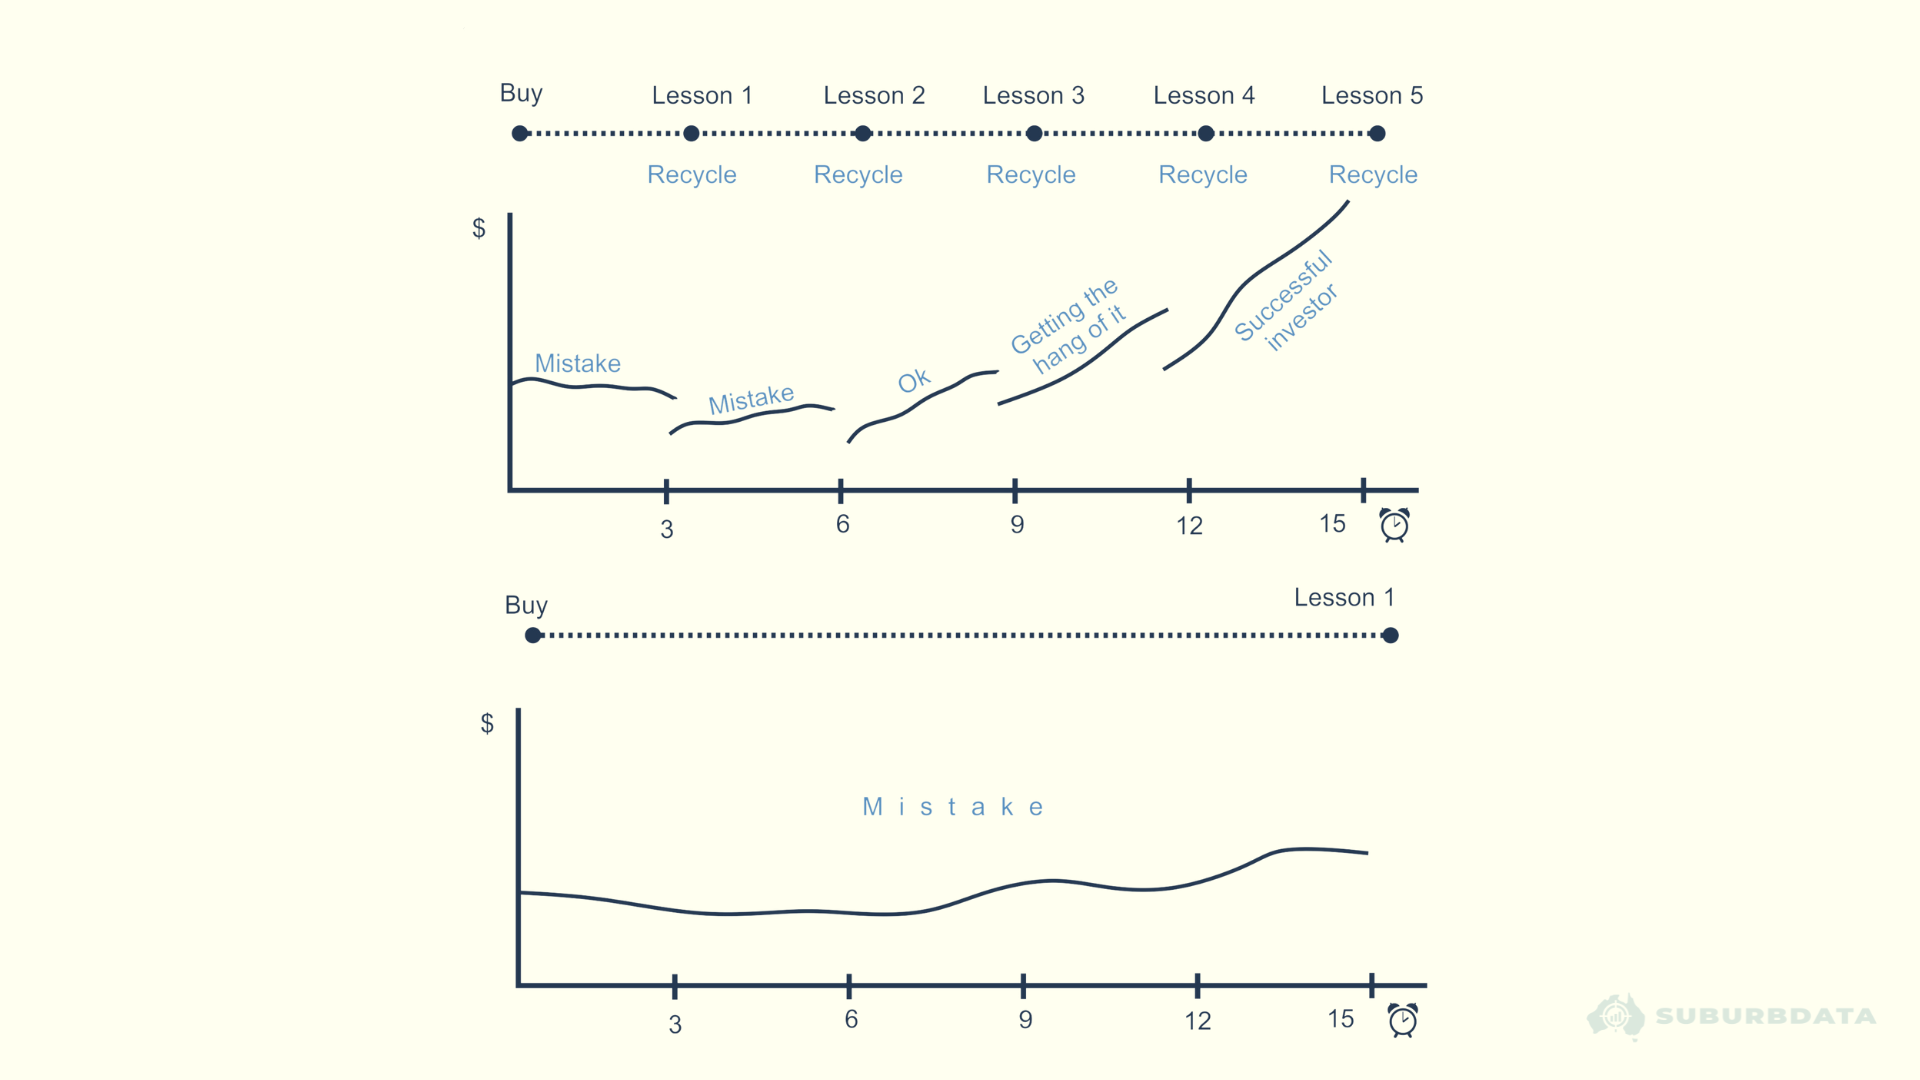
Hold for 15 years and get a disappointing result. You learn one lesson. At the end. Too late to apply it.
A short-term investor knows within 18 months whether a pick was right. They adjust. They improve. Every few years, another lesson refined.
The diagram below shows the difference. The top path shows five cycles of learning and recycling over 15 years. The bottom path shows one long mistake with a single lesson at the end.
Over an investing lifetime, that compounds into genuine expertise. A short-term focus also works at any stage of life. Long-term buy-and-hold is useless for investors nearing retirement.
The Long-Term Future Is Unknowable
Committing to a 20-year hold means betting on conditions you cannot see.
- Driverless cars may reshape some locations
- Remote access technology is already changing where people choose to live
- Magnetic levitation transport could make distant suburbs suddenly desirable
- Climate change is repricing coastal and bushfire-risk markets
Nobody knows which markets will be affected. Technology that does not exist yet will alter property demand in ways nobody has contemplated.
A shorter exit horizon reduces exposure to that risk. The closer the exit, the less time for the world to change in unexpected ways.
Data and AI Are on the Short-Term Investor's Side
The tools to identify short-term outperformers are improving every year. But stretch the forecast beyond 5 years and reliability collapses. The variables multiply. The unknowns compound.
Technology supports short-term forecasting. It does not support long-term forecasting.
The advice to buy-and-hold for the long-term is advice that requires no forecasting ability. Hold long enough and average growth eventually materialises. It is advice from professionals who cannot predict future growth.
Short-term investing is for investors who can.
What Repeating the Strategy Looks Like
Return to the original question. Market A grows fast then flattens. Most investors hold through the flat period waiting for growth that never comes.
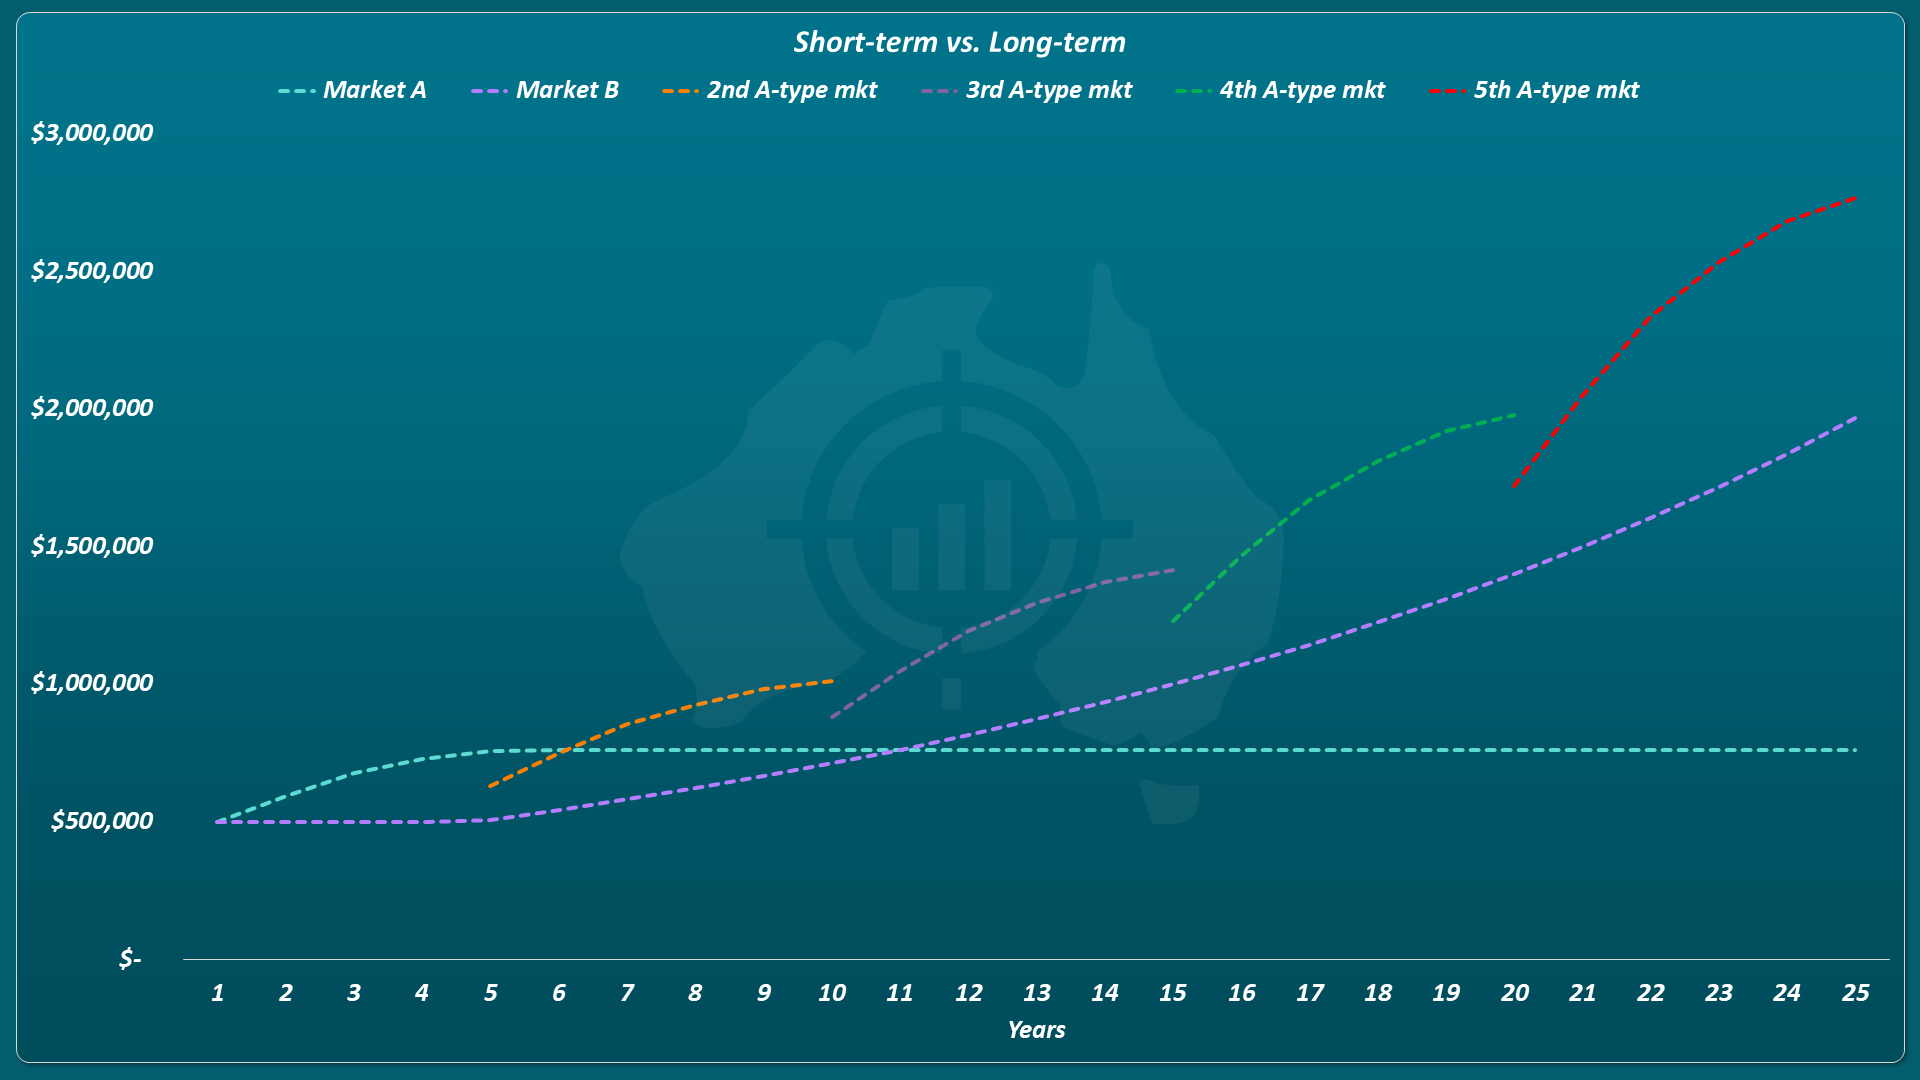
The short-term investor sells at year 5. But instead of moving into Market B, they find another short-term outperformer. Then another. Then another.
Each cycle builds on the last. The chart below exemplifies what five cycles of this strategy produces over 25 years. Each coloured line represents a new short-term market. Compare the top line to Market B held long-term.
The data age now makes trading property viable.
The sit-tight strategy only makes sense if you have no ability to forecast growth. That is exactly why so many advisors recommend it. Staunch buy-and-hold advice is a clear sign of an inability to forecast.
The Conclusion
Short-term growth differences are radical. Long-term growth differences are marginal.
Most growth is recent. Most long-term outperformers are short-term outperformers in disguise.
You learn faster, adapt faster, and compound faster with a short-term focus. Technology makes short-term forecasting more accurate every year.
The long term is made up of short terms. The data shows which ones to pick.
The fastest path to financial freedom through property is not through “long” holds. It is a series of well-chosen “short” ones.