

Many investors rely on past growth. But historical data shows the opposite pattern.
Why Past Performance Does Not Continue
Many property investors look at the growth history of a property or suburb before deciding whether to buy.
If a property has grown strongly in the past, the assumption is that it will continue growing strongly in the future. At first glance, this sounds logical. If something has performed well historically, surely it must be a good investment.
However, historical property data tells a very different story.
When growth patterns are analysed across large numbers of suburbs over long periods of time, a surprising pattern appears. Instead of strong past growth leading to strong future growth, the opposite tends to happen.
Above-average past growth is often followed by below-average future growth.
Understanding why this happens can help investors avoid one of the most common mistakes in property investing.
The Back-Testing Trap
Many professionals claim to “back-test” a property by looking at its historical sales prices.
They gather previous sale records and calculate the compound annual growth rate over time. If the number looks strong, the property is seen as a proven performer.
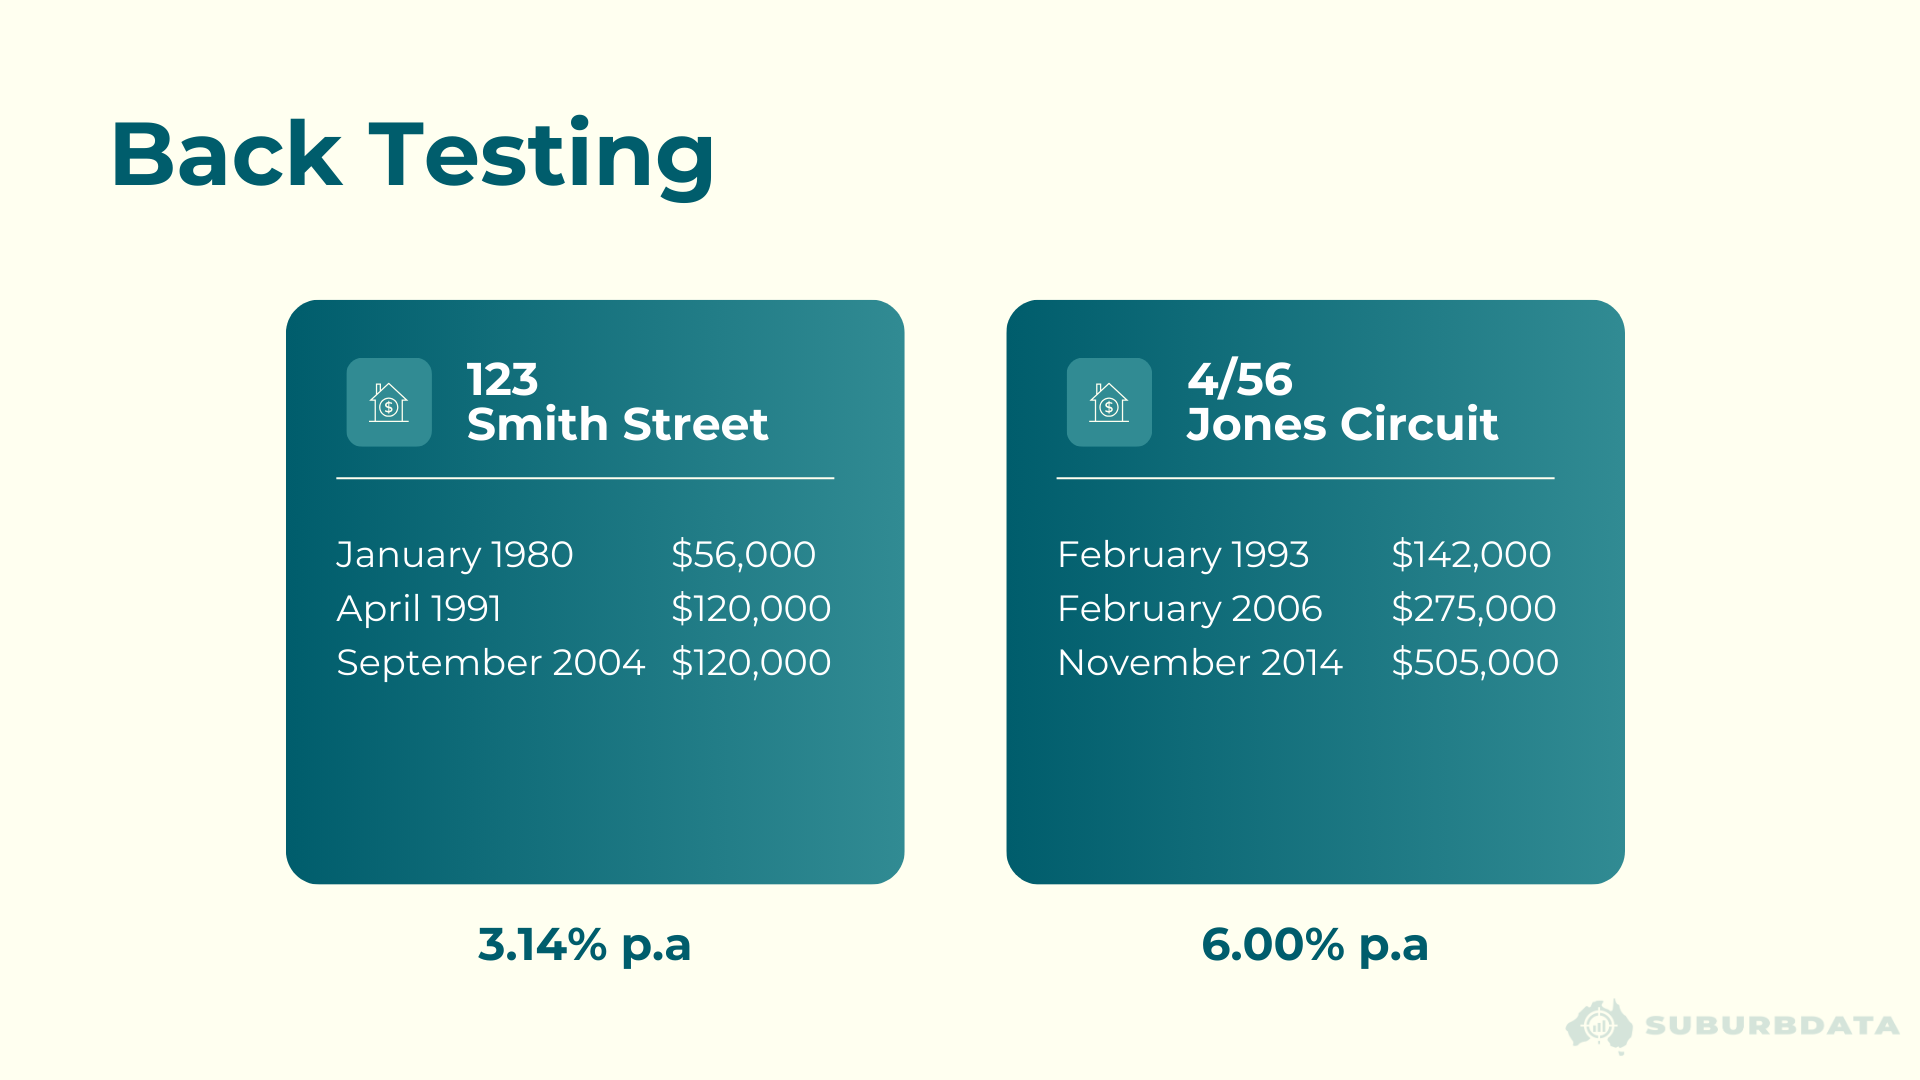
For example, two properties may show very different historical growth rates. One might have achieved 3.14% per year, while another has delivered 6.00% per year. At first glance, the second property appears to be the superior investment.
Because of this, investors often assume that properties with higher historical growth will continue outperforming.
But the reality is often the reverse.
The higher the past growth, the more likely it is that future growth will be weaker.
Ironically, if professionals properly “back-tested”, they would realise this.
Why Property Features Don’t Drive Growth
Many investors believe that certain property features create long-term capital growth.
Things like:
- large land size
- water views
- proximity to beaches
- luxury amenities
- architectural quality
These features certainly affect property prices. Buyers are willing to pay more for them.
But they do not drive long-term price growth.
Instead, property features simply determine price differences between comparable properties.
To understand this, imagine two properties:
Property A sits on a large block near the beach with excellent views and amenities.
Property Z is on a smaller block far from major amenities.
Naturally, Property A will be worth more. Buyers place a premium on those features.
But that premium is already reflected in the price. Once the market has priced those features in, they do not continue generating additional above-average growth year after year.
For example, a property with a better view might sell for 10% more than neighbouring homes. But that difference tends to remain relatively stable over time.
The view creates a price difference, not ongoing price growth.
Growth Is Driven by Supply and Demand
Price growth in property markets is determined by supply and demand, not by the physical features of a property.
Demand depends on factors such as affordability, population movements, economic conditions and buyer preferences.
Importantly, demand is also influenced by price itself.
If a property becomes very expensive relative to alternatives, demand for that property or market may weaken. Buyers start searching for more affordable options.
At the same time, cheaper markets become more attractive. Demand shifts toward those areas, increasing their growth rate.
This creates a natural balancing effect across property markets.
What the Historical Data Shows
To test the relationship between past growth and future growth, historical property data from Australian suburbs was analysed.
Thirty-year periods were examined across thousands of suburbs. Each period was divided into two sections:
- the first 10 years, representing past growth
- the following 20 years, representing future growth
For each suburb, the 10-year growth rate was calculated. Suburbs were then grouped into narrow ranges based on that growth.
The median growth for the following 20 years was then measured for each group.
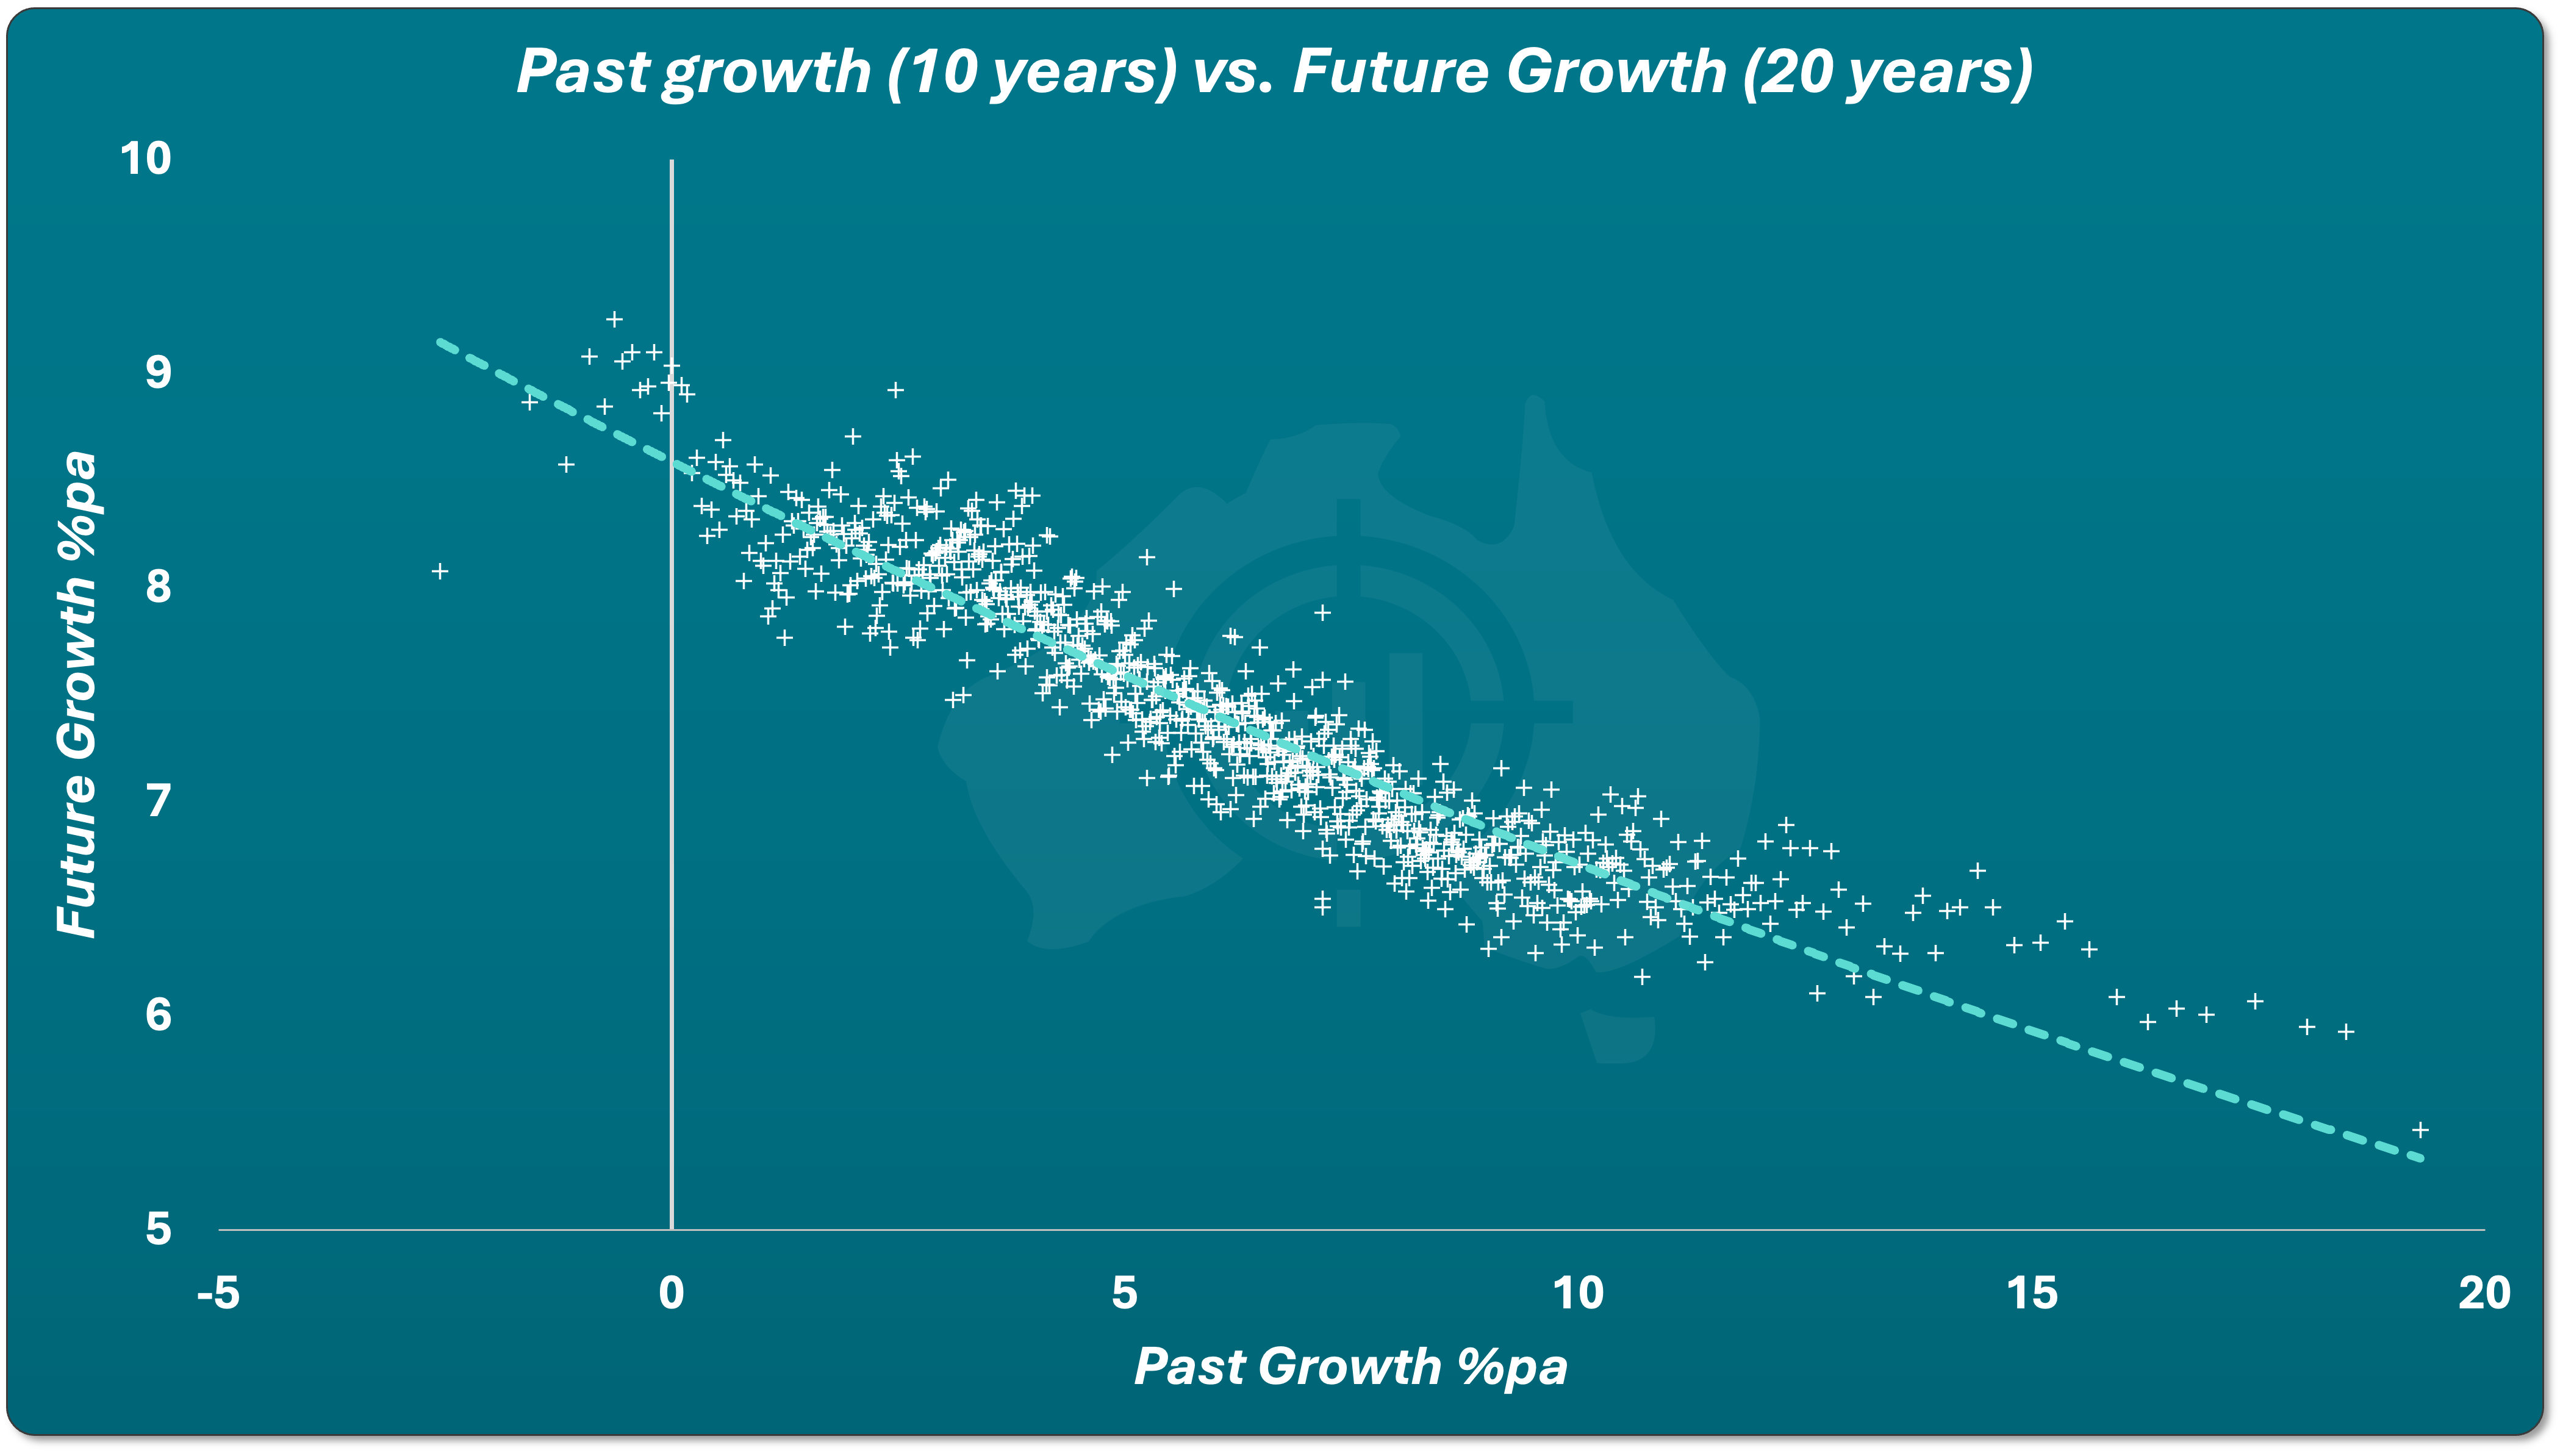
When plotted on a chart, the results are striking.
Instead of seeing a positive relationship between past and future growth, the chart shows a clear inverse relationship.
Suburbs that experienced poor growth in the first decade often delivered strong growth in the following two decades.
Meanwhile, suburbs that had exceptional growth in the first decade frequently delivered the weakest performance afterwards.
Testing Different Time Periods
To ensure this pattern was not specific to the era examined, the analysis was repeated using different timeframes.
The relationship was tested using several combinations:
- 20 years of past growth followed by 10 years of future growth
- 15 years of past growth followed by 15 years of future growth
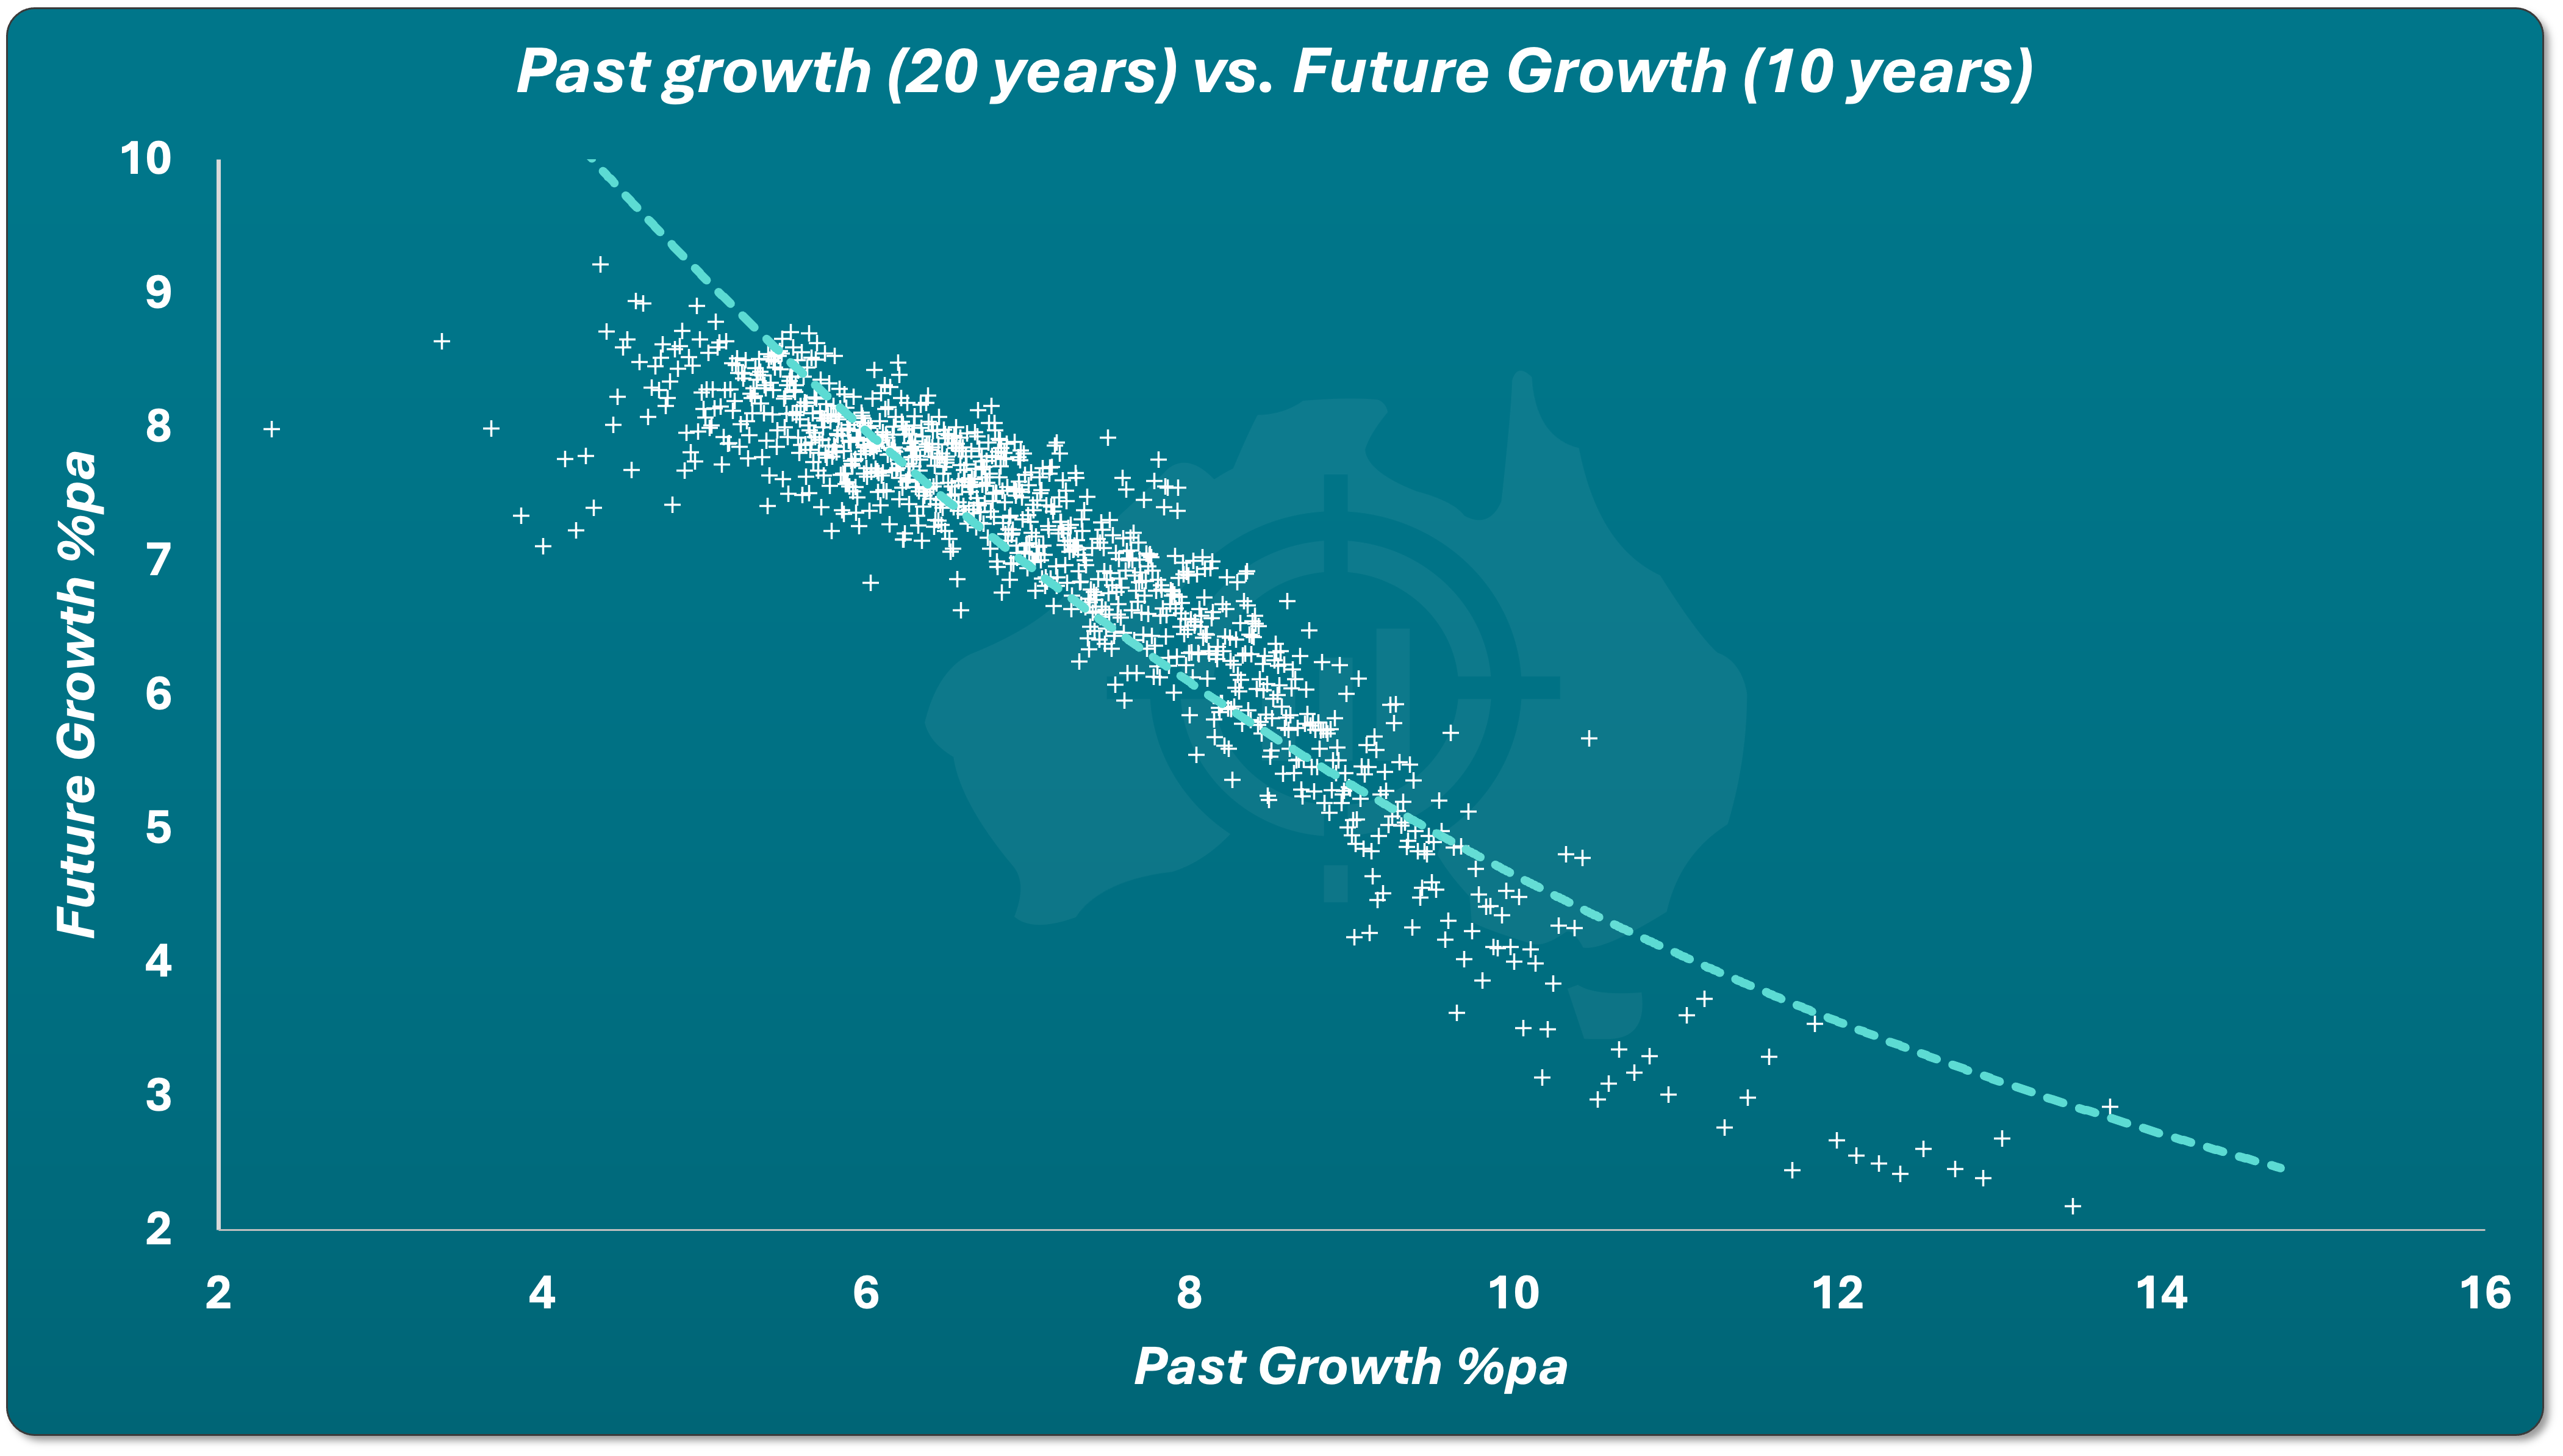
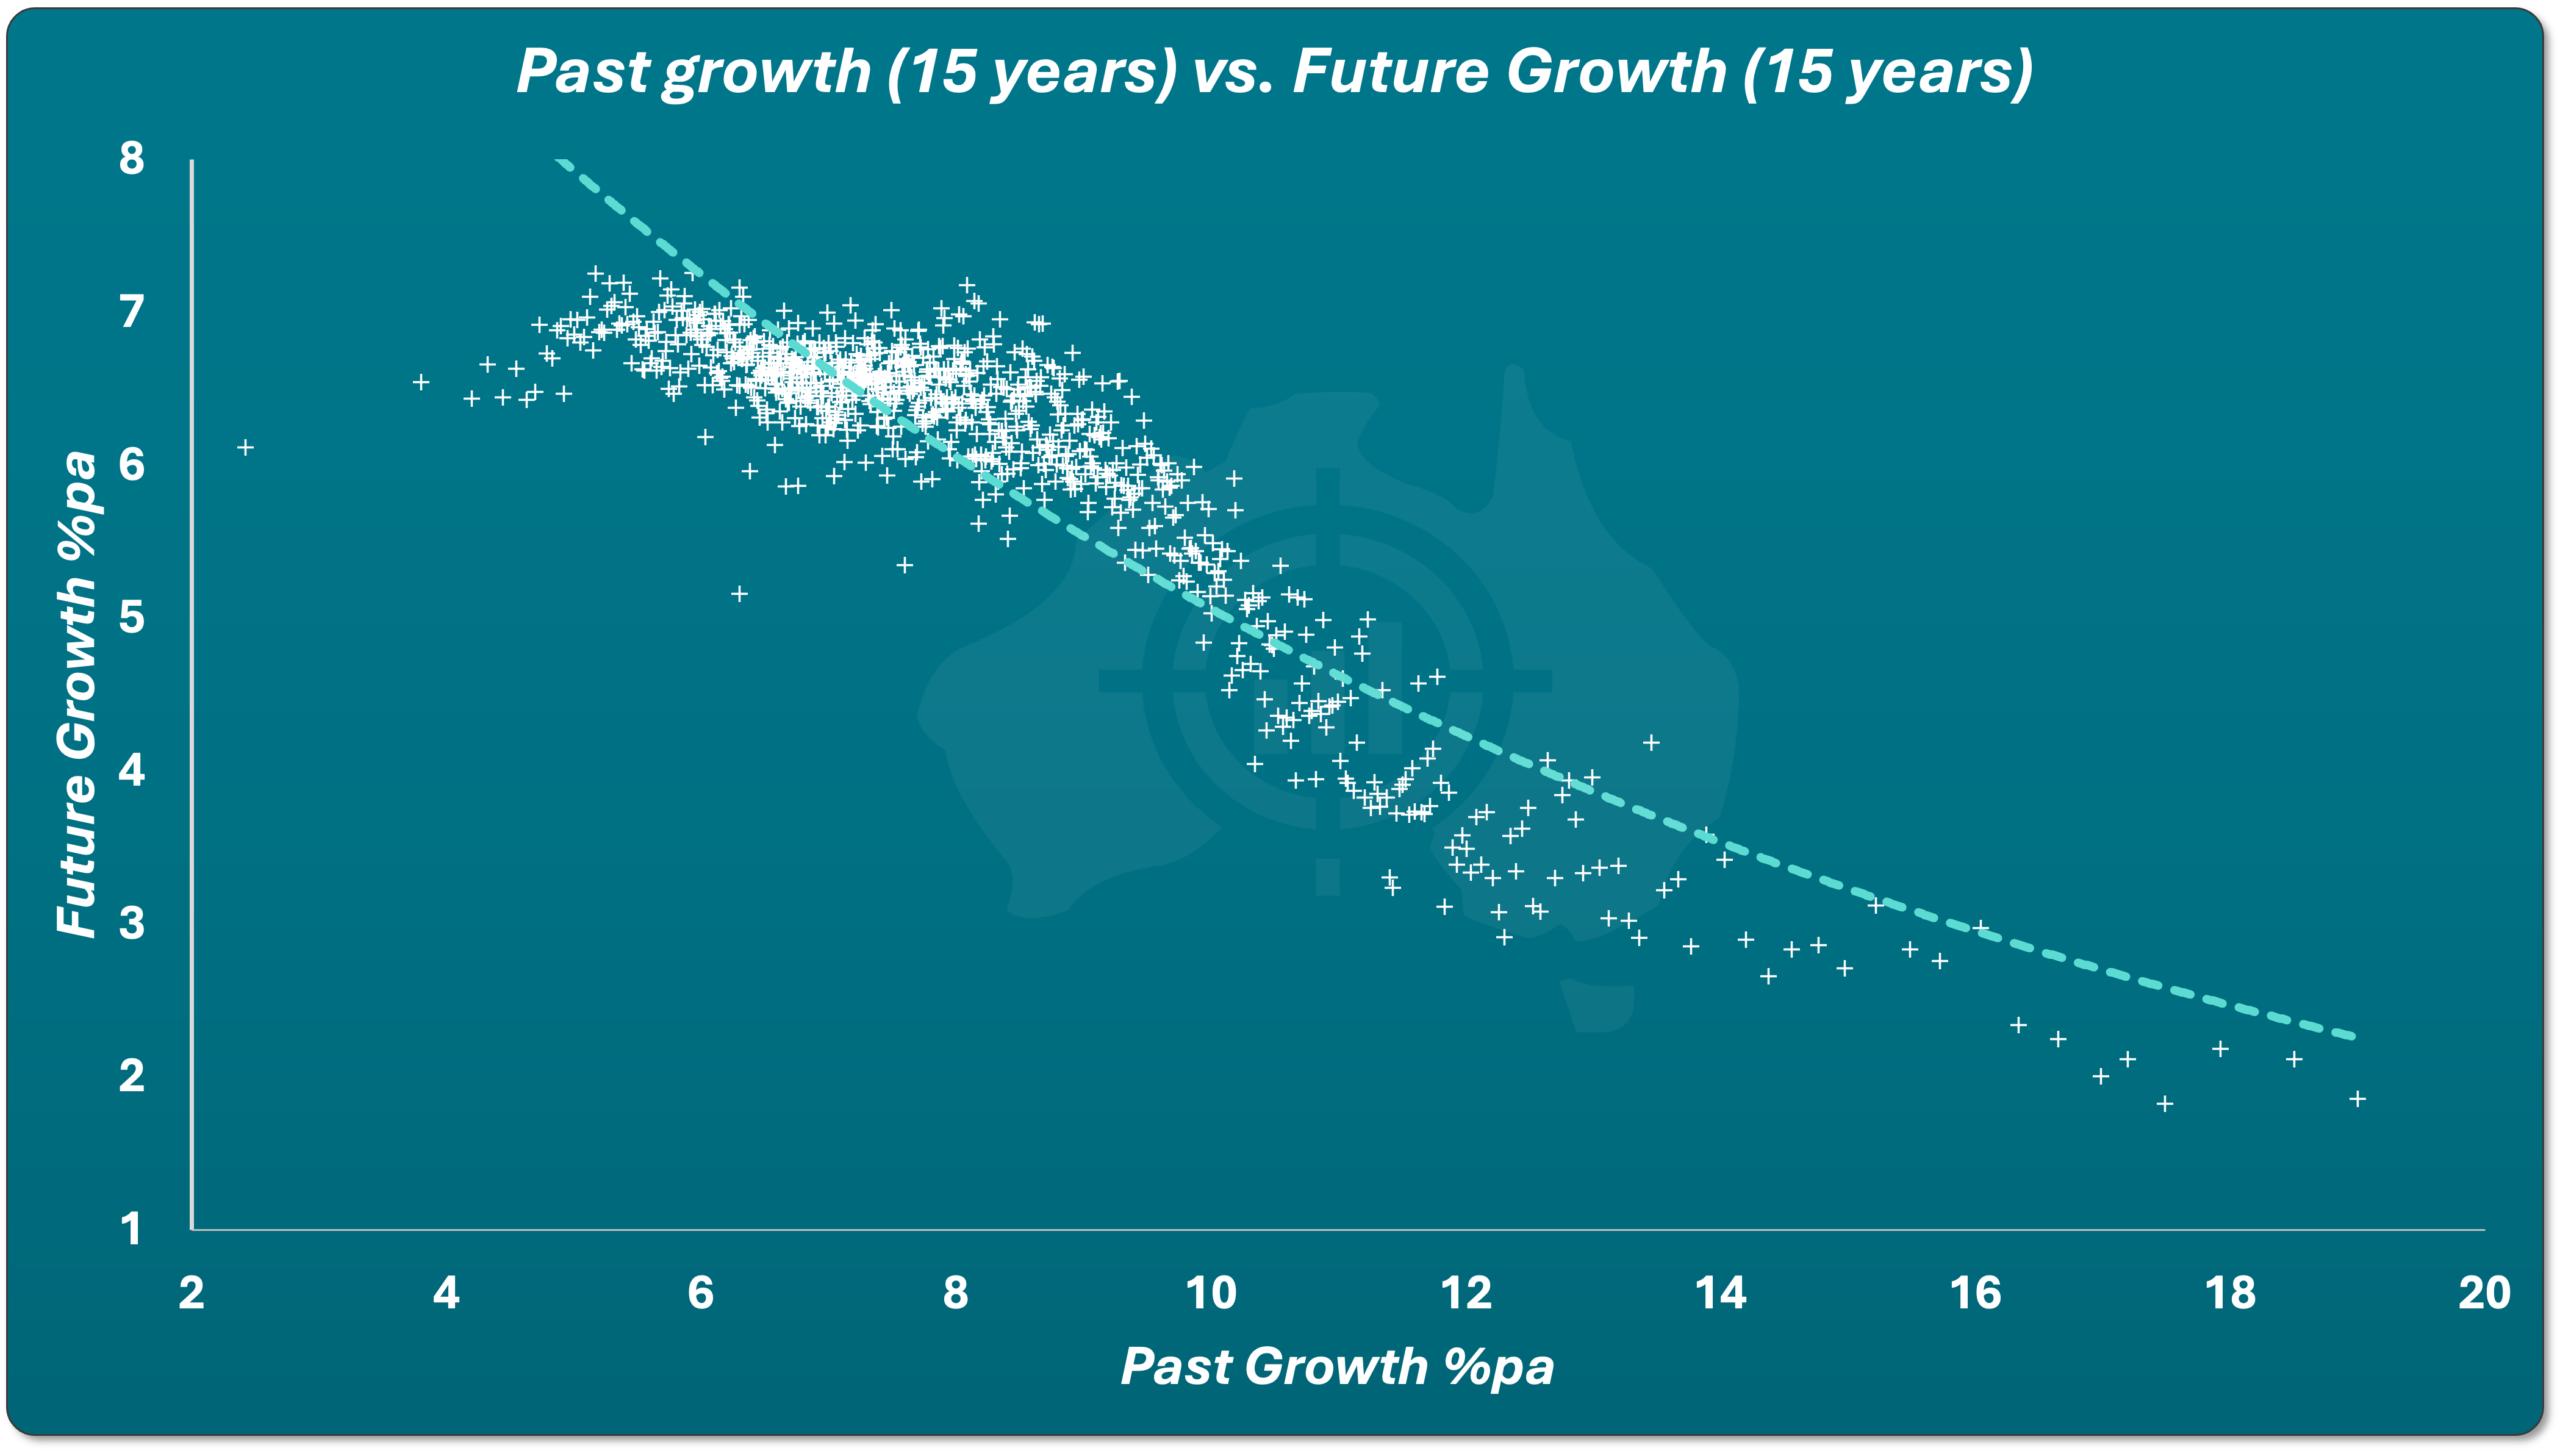
Each time, the same pattern emerged.
Markets with higher past growth tended to experience lower future growth.
Markets with weaker past growth were more likely to outperform later.
This pattern appears consistently across Australian property markets.
Another Way to See the Pattern
The same relationship can also be visualised by grouping suburbs based on their 10-year past growth and comparing how those same suburbs performed in the next decade.
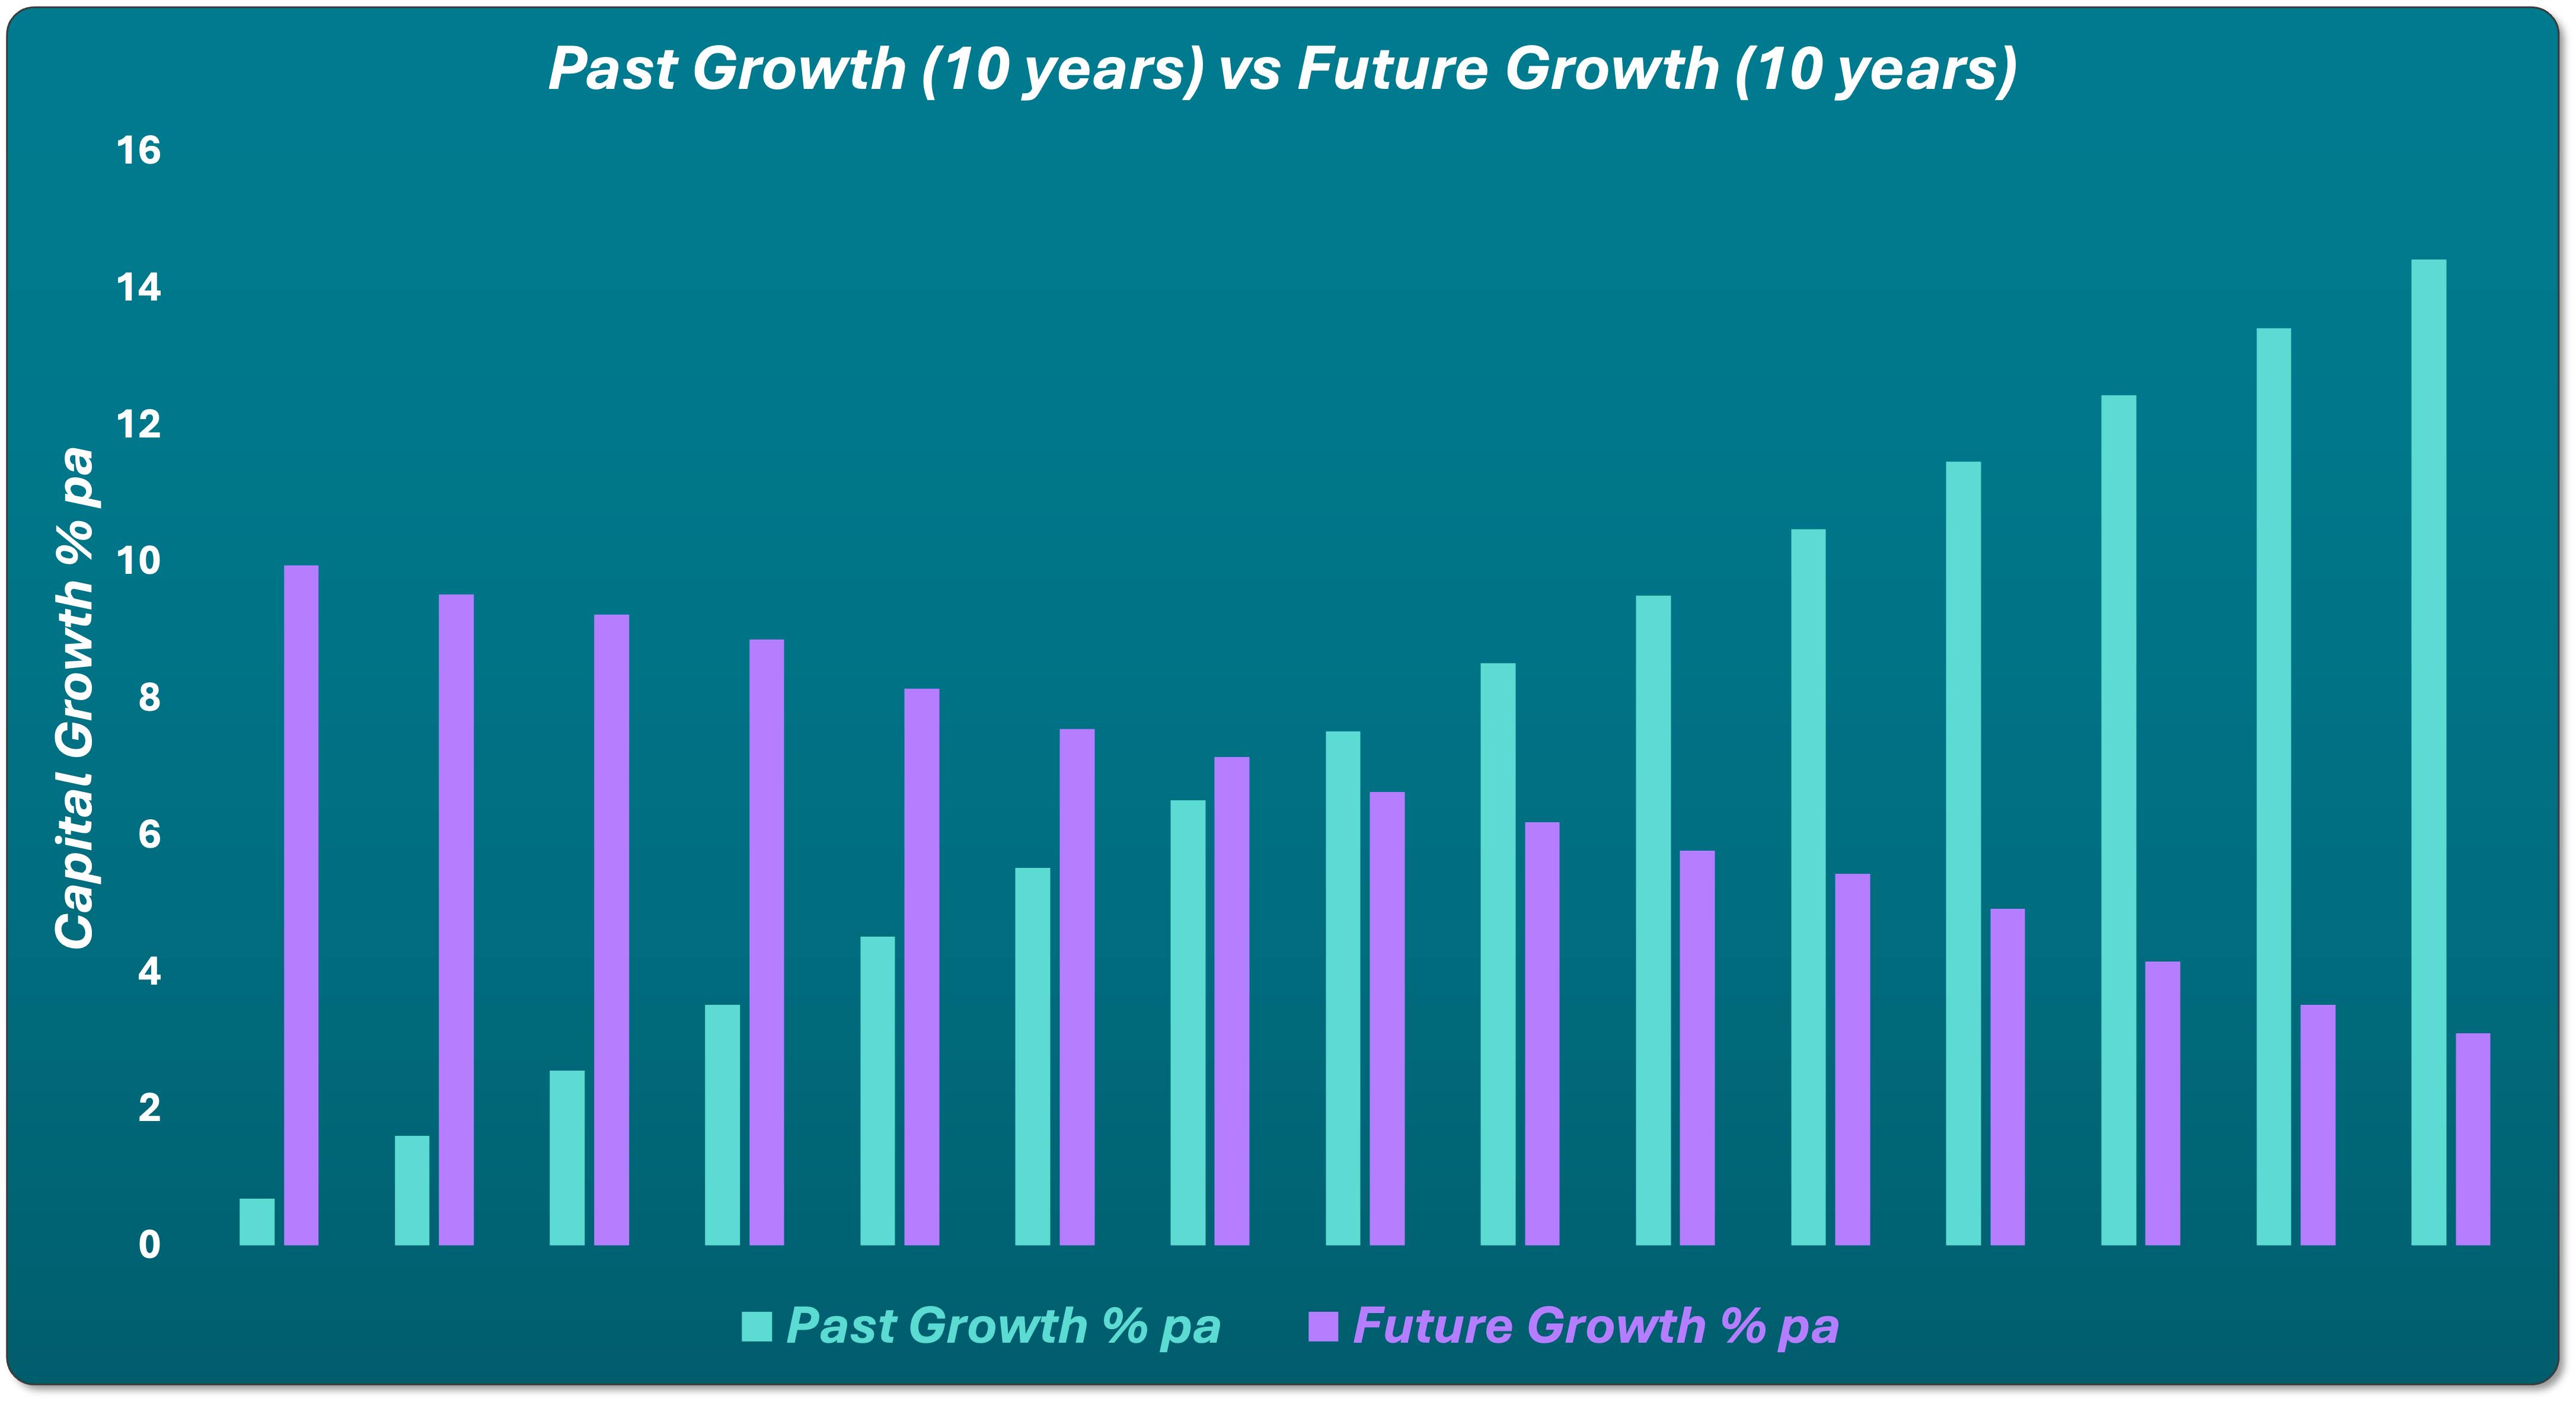
Suburbs that experienced very weak growth in the first decade often produced strong growth in the second.
Meanwhile, suburbs that had spectacular growth early on, frequently slowed down afterwards.
Across hundreds of thousands of observations, the relationship remains remarkably consistent.
No suburb, city or property market can outperform the broader market indefinitely.
Why Growth History Can Be Misleading
Another issue with relying on growth history is that individual property data can easily be distorted.
For example, historical growth may appear stronger than reality because of:
- renovations
- extensions
- granny flats
- full rebuilds
The opposite can also happen.
Distressed sales, mortgage repossessions, deceased estates or subdivided land can suppress historical prices and make growth appear weaker than it truly was.
Because of these distortions, relying on individual property growth history can be highly misleading.
Looking at broader suburb-level data provides a more reliable picture.
Conclusion
Growth history can help investors understand property markets, but not in the way many industry professionals believe.
Many experts recommend targeting suburbs with strong past performance. However, historical data suggests the opposite is often true. Markets that have experienced strong growth frequently slow down, while those with weaker growth tend to catch up.
In other words, if past growth is considered at all, lower past growth may be more useful than higher past growth.
Growth figures can also be distorted by renovations, distressed sales and other unusual transactions, making individual property histories unreliable.
Relying purely on growth history can lead investors to buy at the peak of a market. Understanding supply and demand provides a far more reliable guide to future opportunities.