

Experts tell investors to buy and never sell. Stamp duty, capital gains tax (CGT), and agent fees eat into profits.
That advice was rational once. Forecasting capital growth was unreliable.
It is no longer the best advice. Data analysis has changed what is possible.
Growth Happens in Cycles
The diagram below on the left shows the realistic shape of property growth over time. The diagram on the right is the one fake experts believe in. But it never happens.
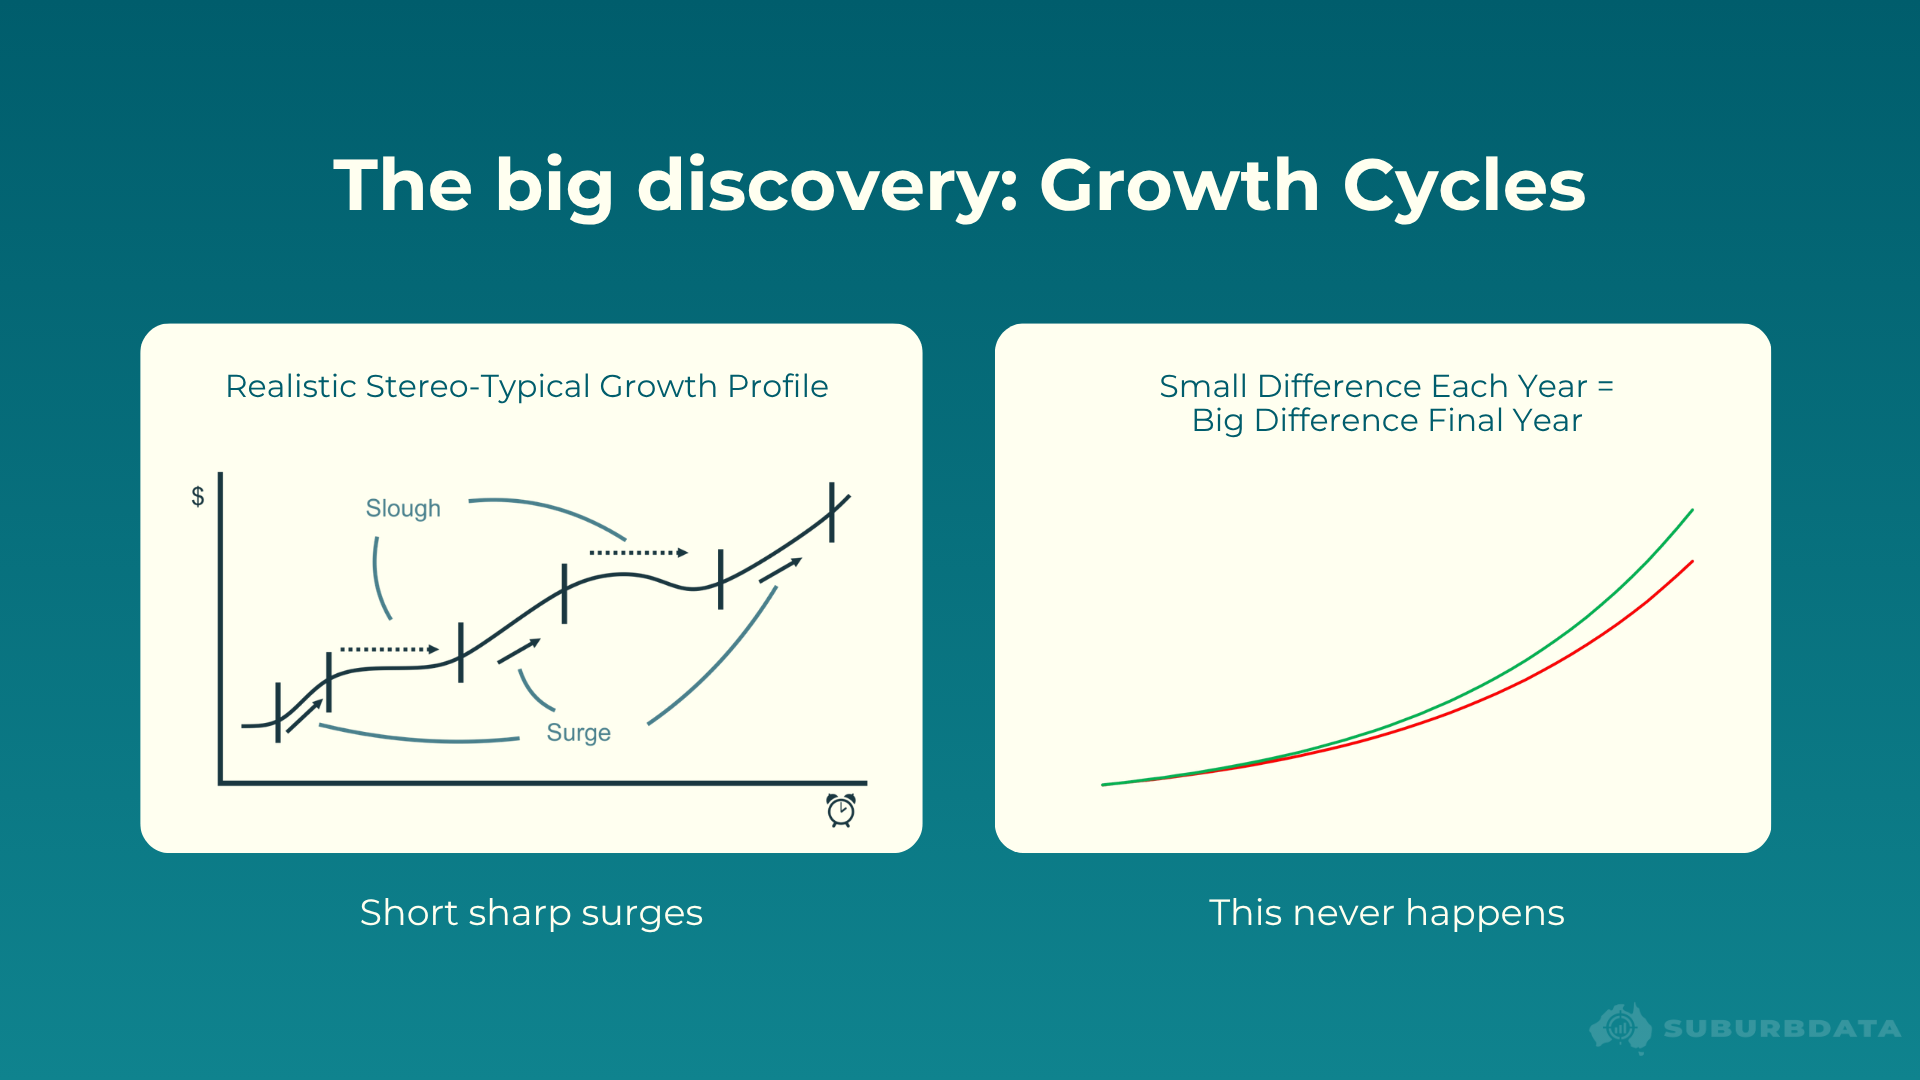
Growth does not happen steadily. It happens in short surges followed by long flat periods.
The bursts are short. The gaps between them can be long.
When the surge in your market ends, the surge is starting somewhere else. Holding means missing the next one.
The Decision Comes Down to Two Numbers
Whether to sell is a comparison between two costs:
- Opportunity cost. What you miss out on by holding instead of trading.
- Equity reallocation cost (a.k.a. recycle cost). The transaction costs of selling and buying again.
If opportunity cost is greater, sell. If reallocation cost is greater, hold.
What the Costs Look Like
Exit cost: around 13% of property value.
- Selling agent commission: 2%
- Legal fees: minor
- Capital gains tax: 11%
The CGT walk-through, assuming a 50% gain, owned in personal name, top marginal rate:
- Gross gain: 50%
- After deducting entry and exit costs of 6%: 44%
- After 50% CGT discount (held more than 12 months): 22%
- After 47.5% marginal rate: 10.5%
Rounded to 11%. CGT is most of the exit cost. (Note that these CGT calculations may not apply to all investors and all property types).
Re-entry cost: around 5%. Stamp duty makes up the bulk.
Total cost to move equity: 16% to 18% of property value.
The trade only works if the replacement is forecast to grow by more than 16% above the current property over coming years.
Recycle vs Opportunity
The diagram below shows how the trade pays off.
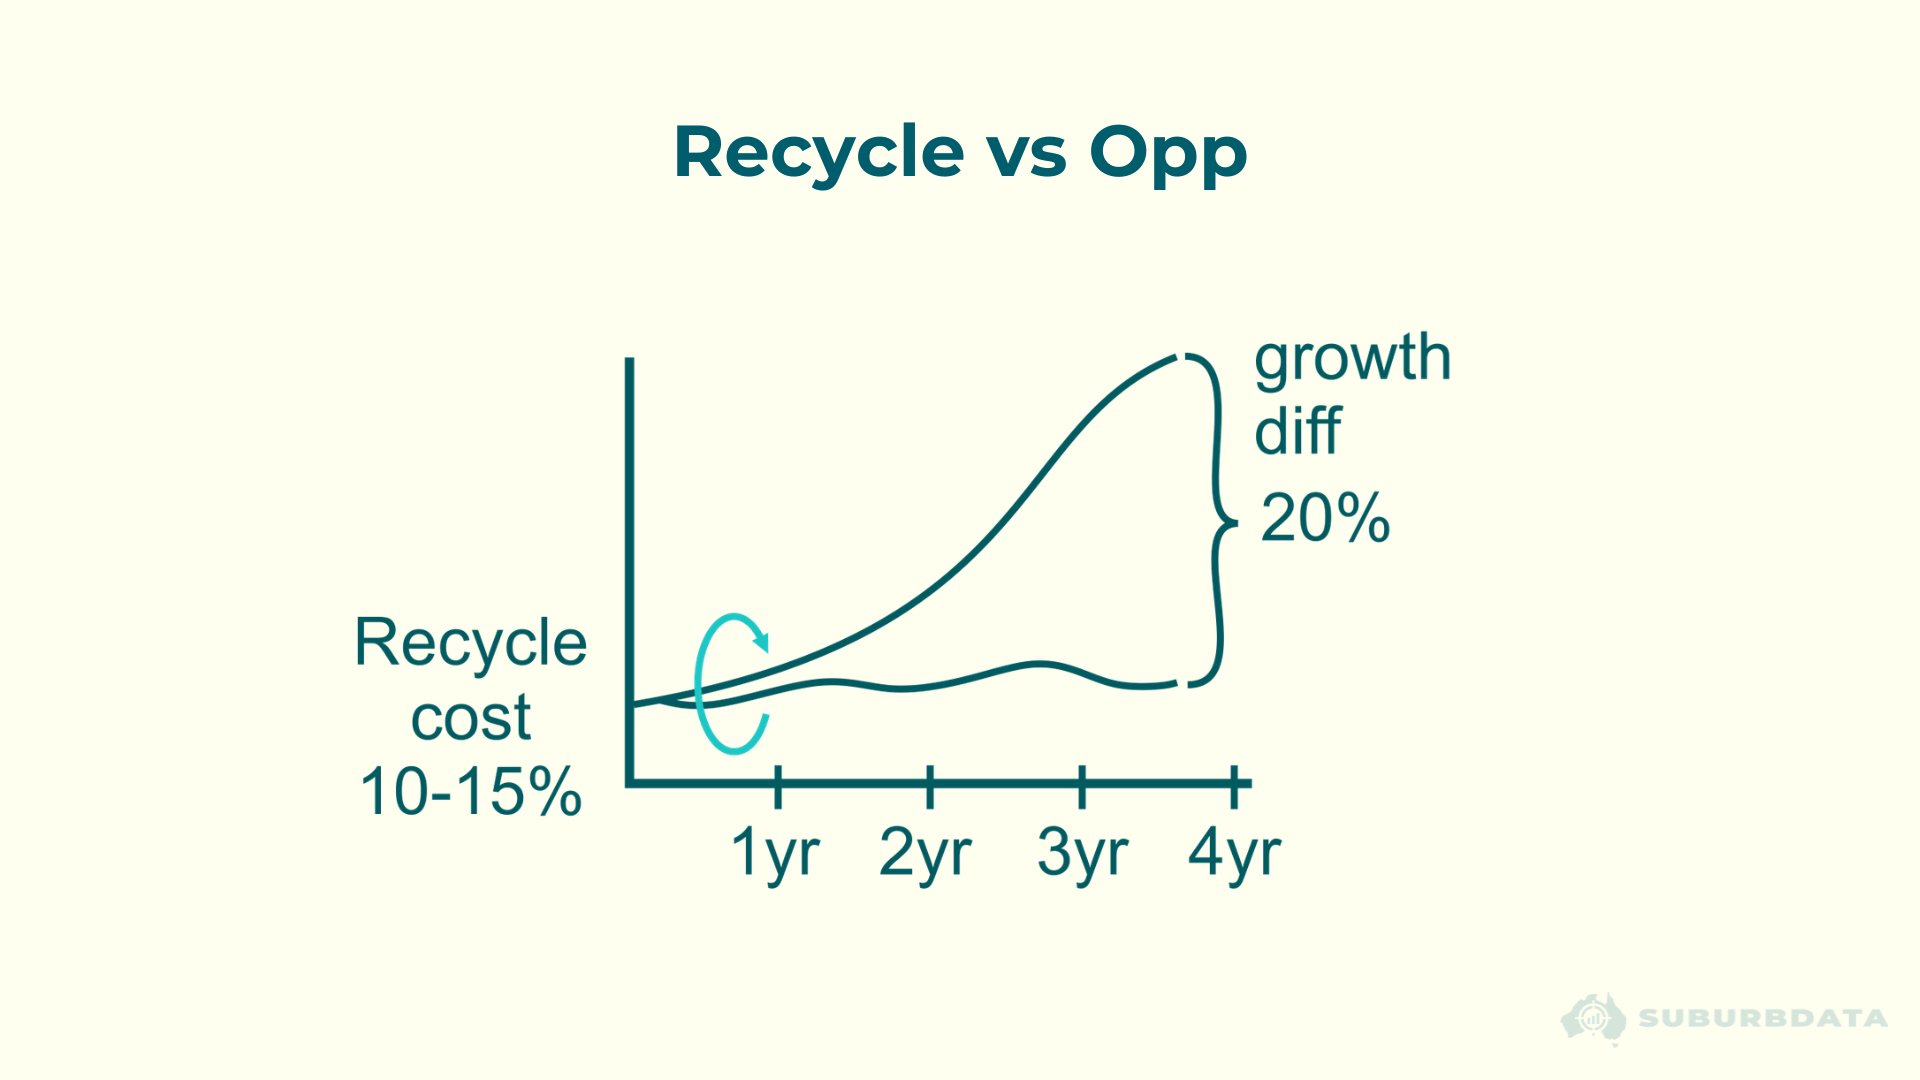
The recycle cost stays fixed at 10 to 15%.
The opportunity cost grows.
Sell when the current property is forecast for low growth and the alternative is forecast for double-digit growth.
Sunshine Coast Outperforms Sydney
The chart below shows growth in Sydney and the Sunshine Coast from 1990 to 1995.
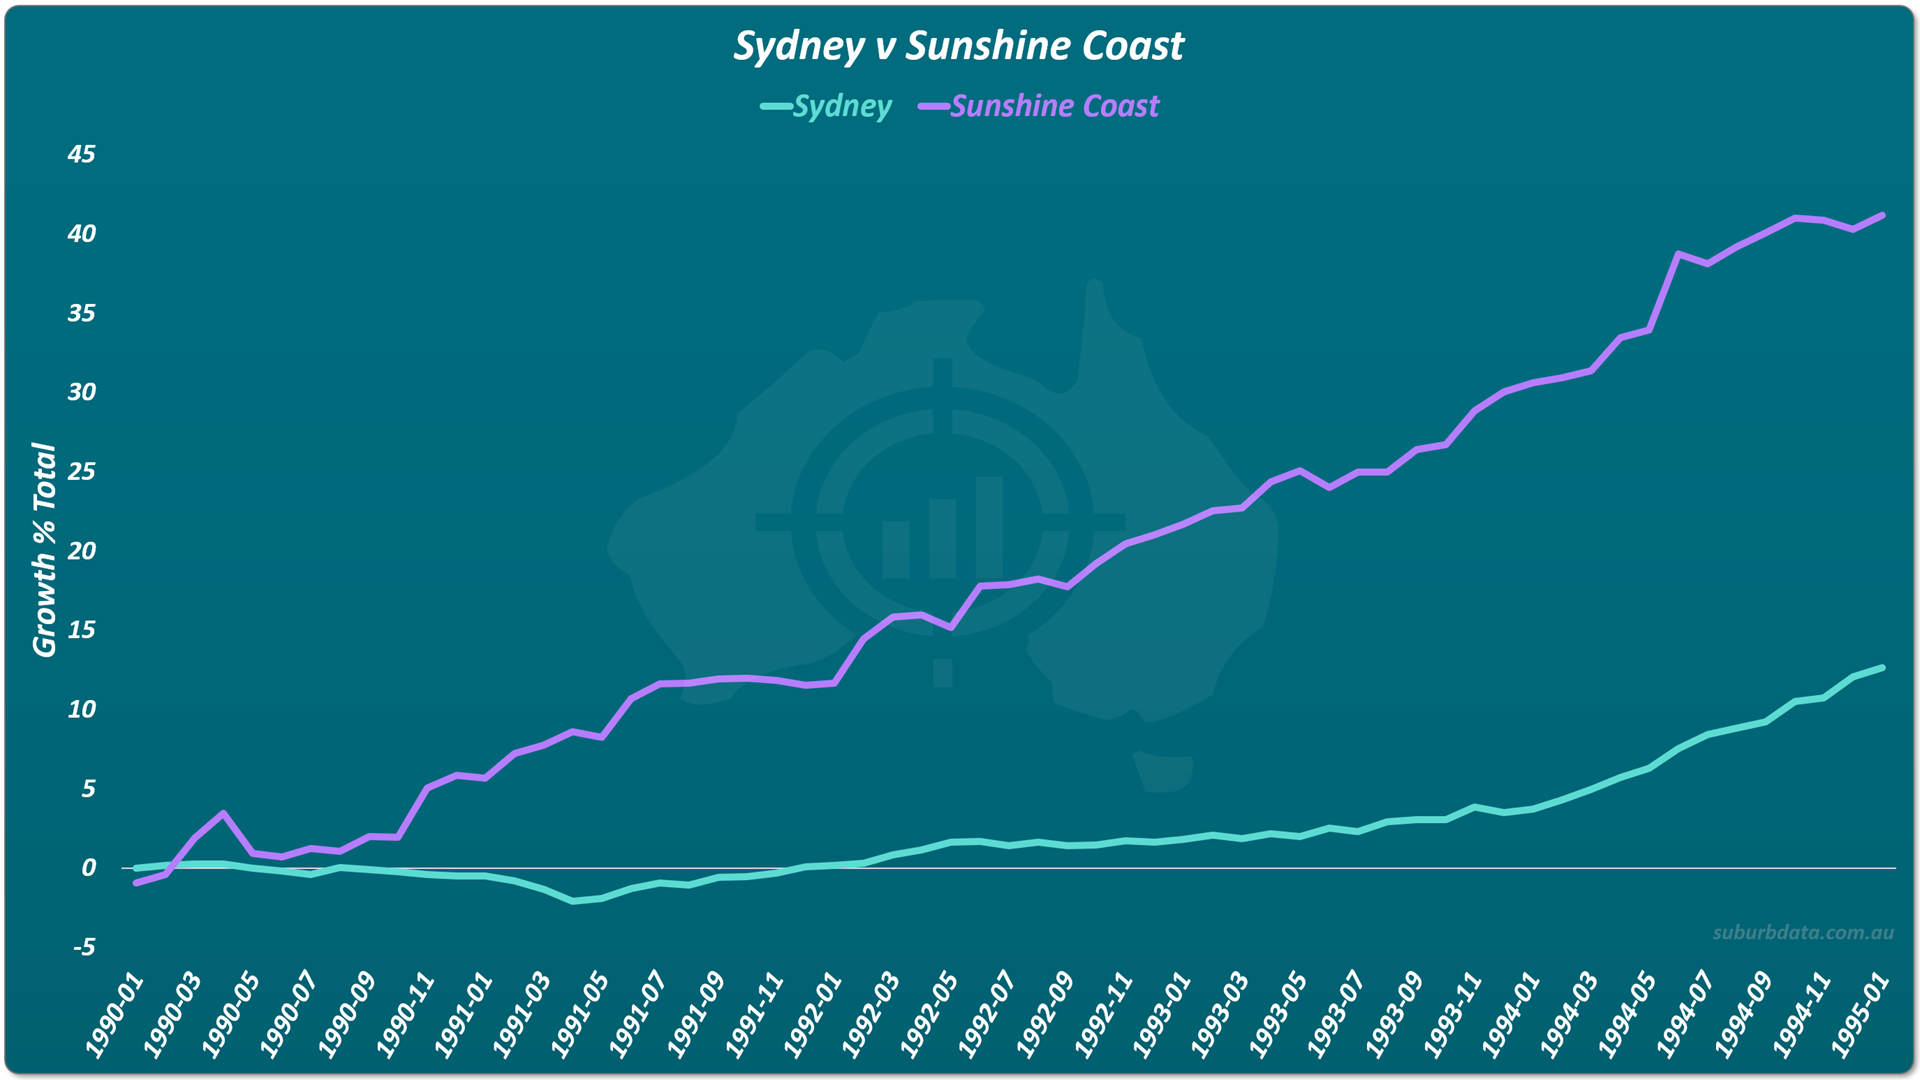
Period: 1990 to 1995
Duration: 5 years
Sunshine Coast: plus 40%
Sydney: plus 12%
Growth gap: 28%
Should the Sunshine Coast investor hold?
Sydney Takes the Lead
The chart below shows the same two cities from 1995 to 2000.
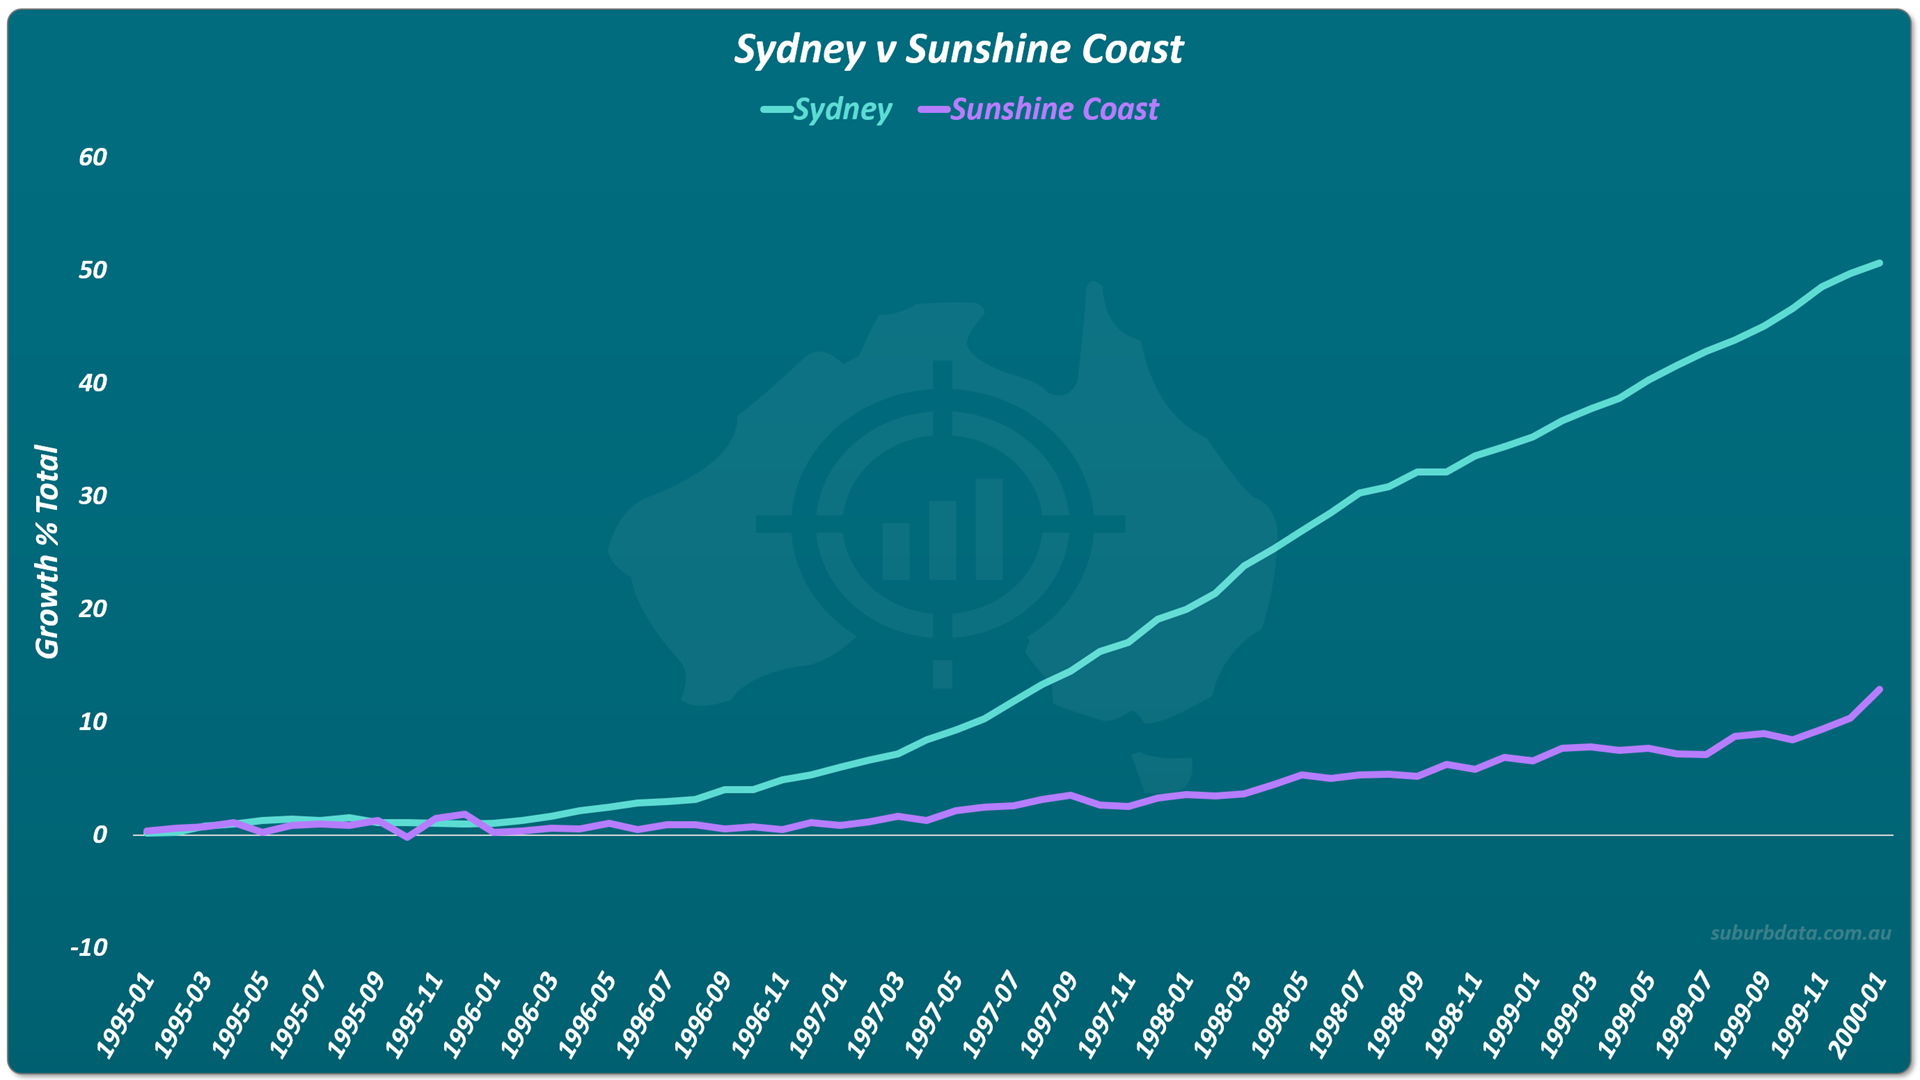
Period: 1995 to 2000
Duration: 5 years
Sydney: plus 50%
Sunshine Coast: plus 12%
Growth gap: 38%
The investor who sold Sunshine Coast in 1995 lost 15% to 20% to costs.
By 2000, they had clawed it back and gained 20% on top.
Sunshine Coast Reclaims the Lead
The chart below shows the same two cities from 2000 to 2005.
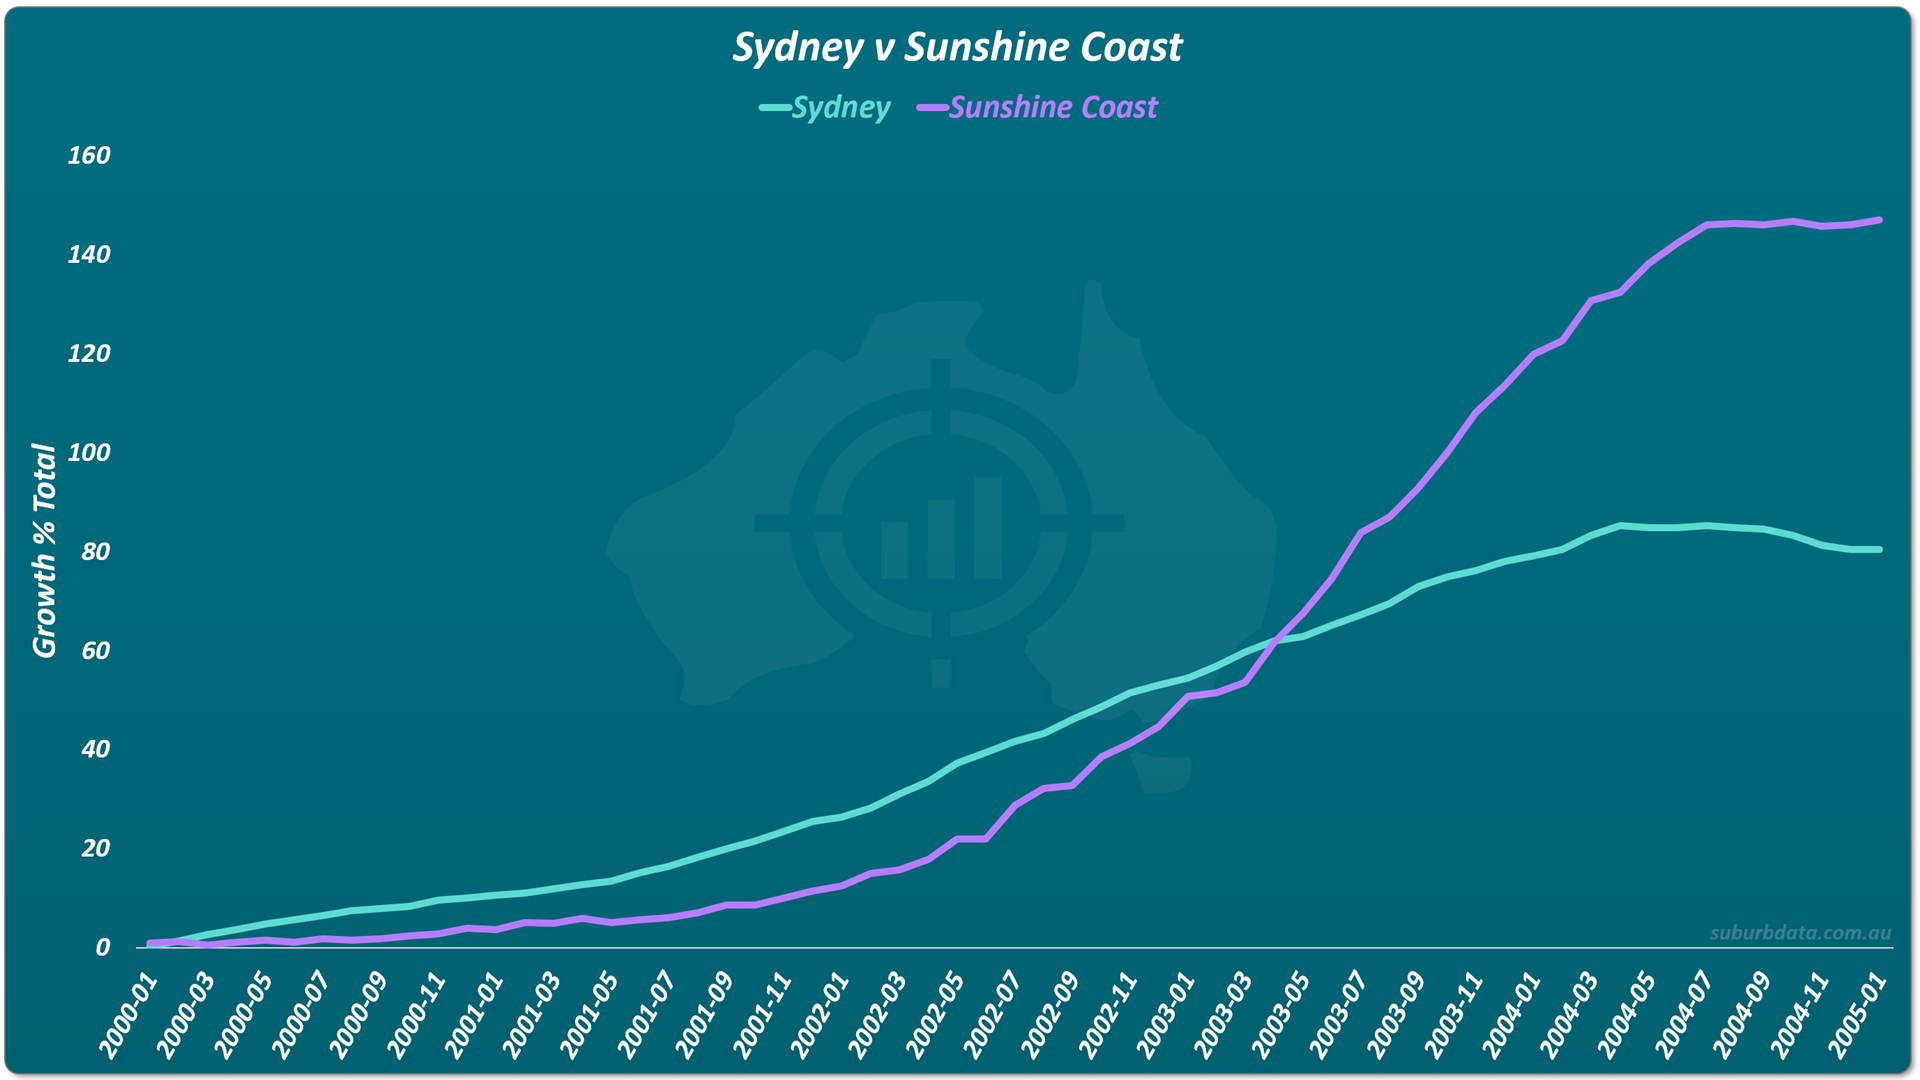
Period: 2000 to 2005
Duration: 5 years
Sunshine Coast: plus 148%
Sydney: plus 80%
Growth gap: 68%
The investor who sold Sydney in 2000 lost 20% to costs.
By 2005, they were 45% to 50% ahead on top of clawing back the costs.
The holder made money. The trader made considerably more.
Perth Boom, Sunshine Coast Stagnation
The chart below shows Perth and Sunshine Coast from 2005 to 2010.
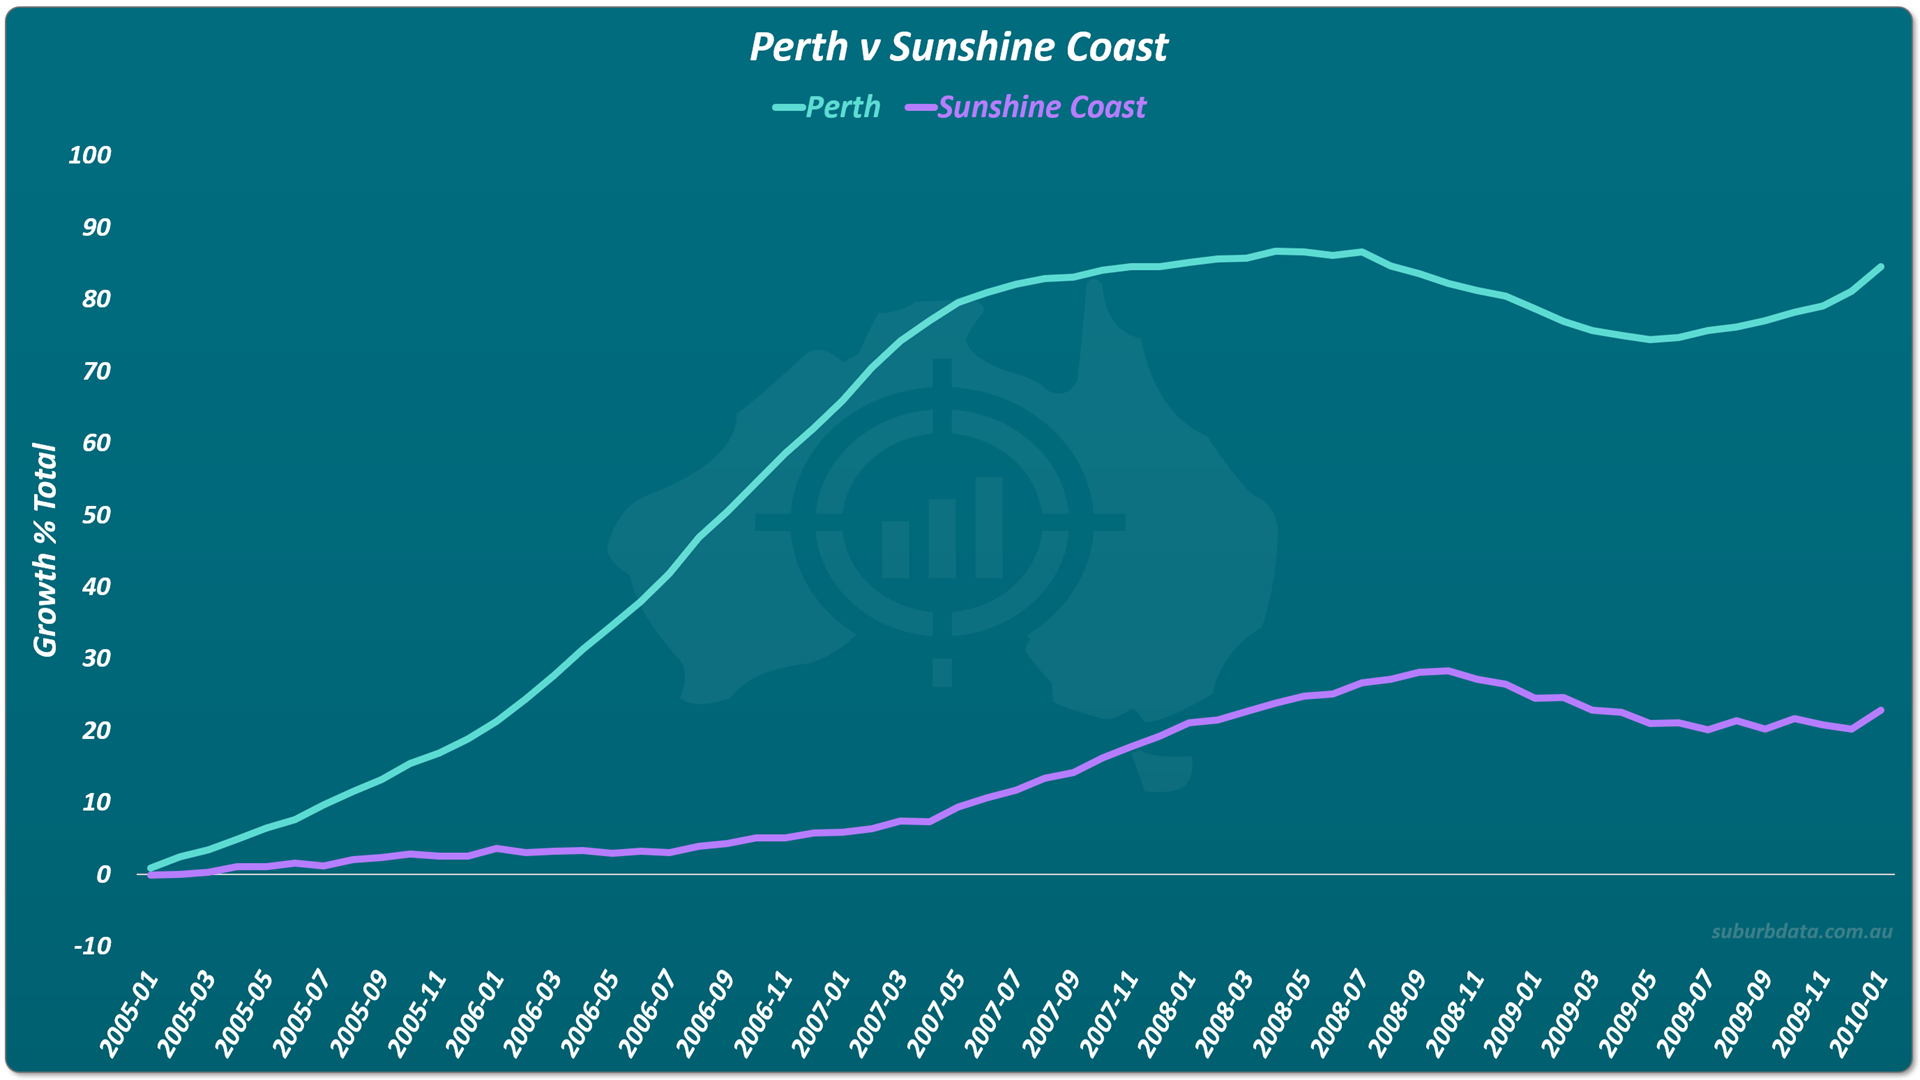
Period: 2005 to 2010
Duration: 5 years
Perth: plus 82%
Sunshine Coast: plus 22%
Growth gap: 60%
The investor selling Sunshine Coast in 2005 lost close to 40% in costs. CGT alone was 30% because the property had grown so much.
By 2010, they had clawed it all back and gained 20% to 25% on top.
The Trade Does Not Always Work
The chart below shows Perth and Sydney from 2010 to 2015.
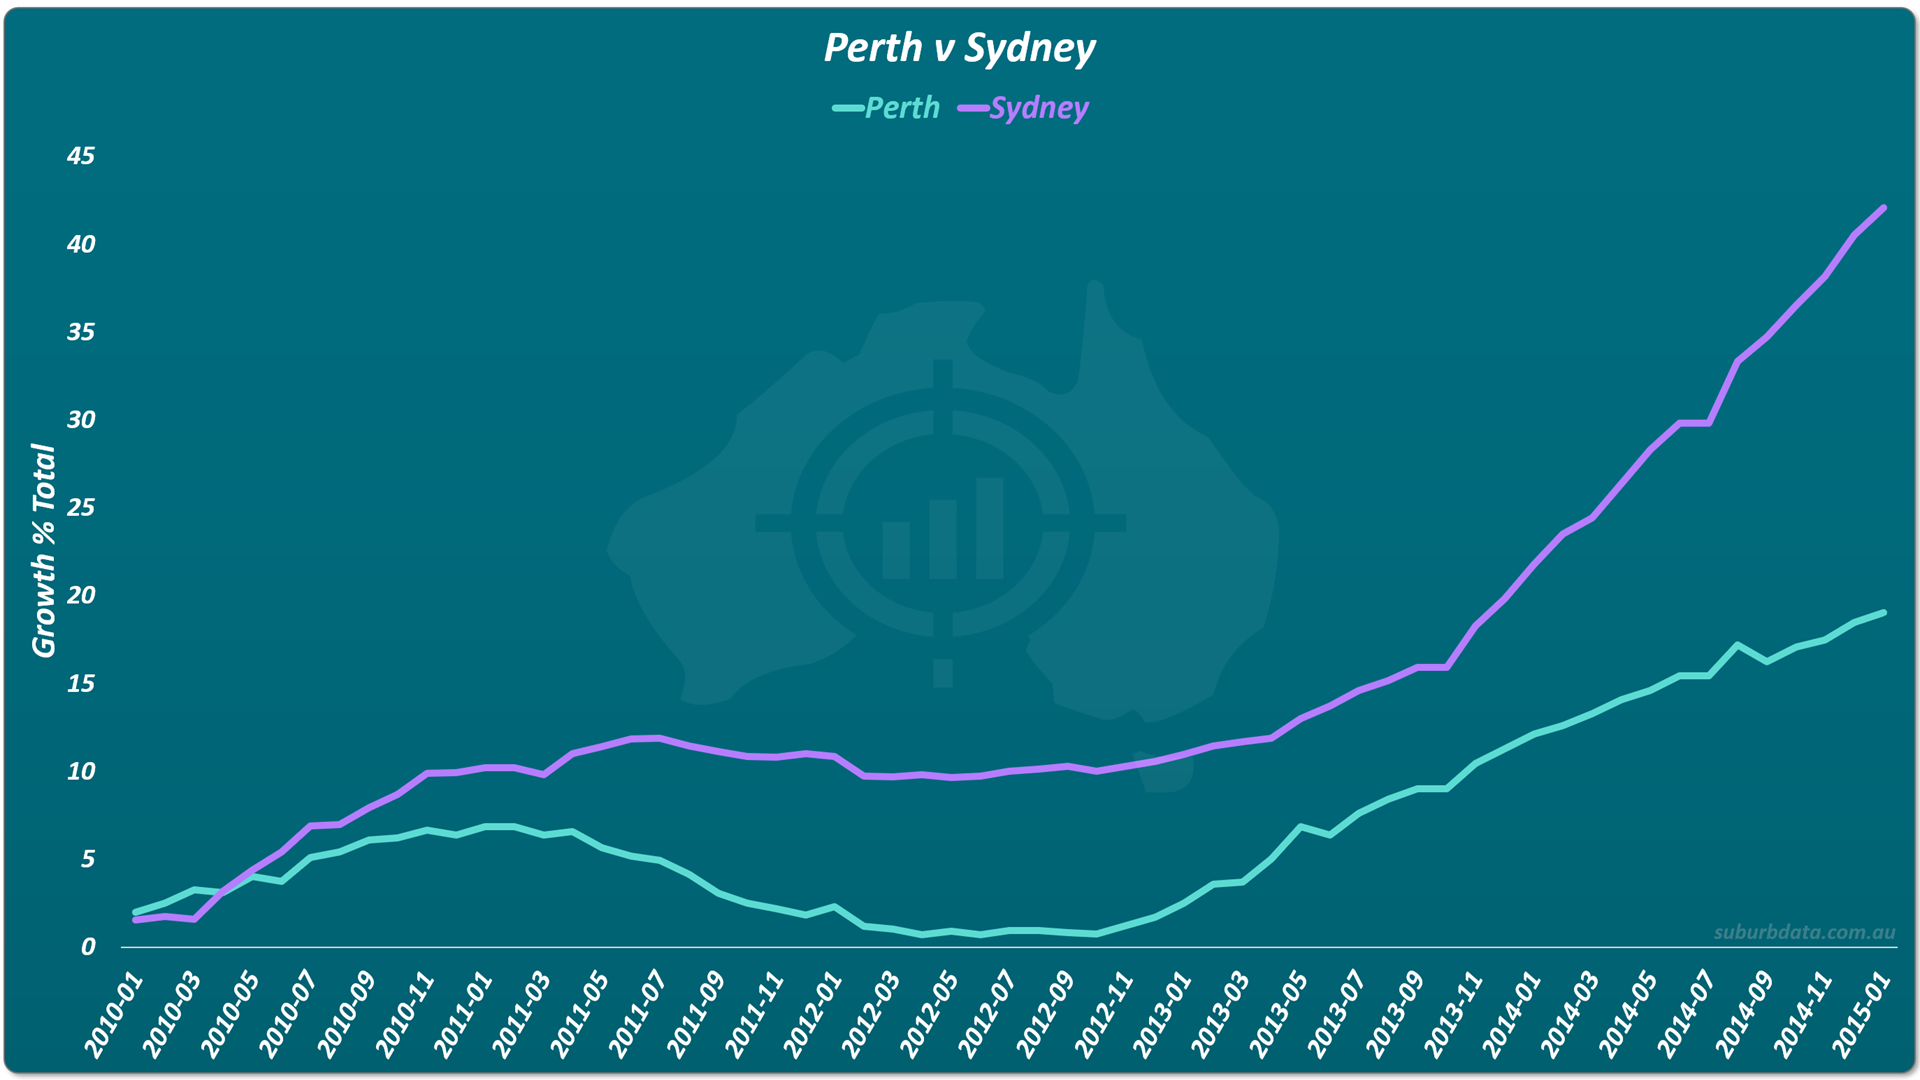
Period: 2010 to 2015
Duration: 5 years
Sydney: plus 42%
Perth: plus 19%
Growth gap: 23%
Reallocation cost: 25%
Result: trade lost 2%
The growth gap has to comfortably exceed the cost to move equity. Where it does not, holding is the better position.
Hobart Booms, Perth Falls
The chart below shows Perth and Hobart from 2015 to 2020.
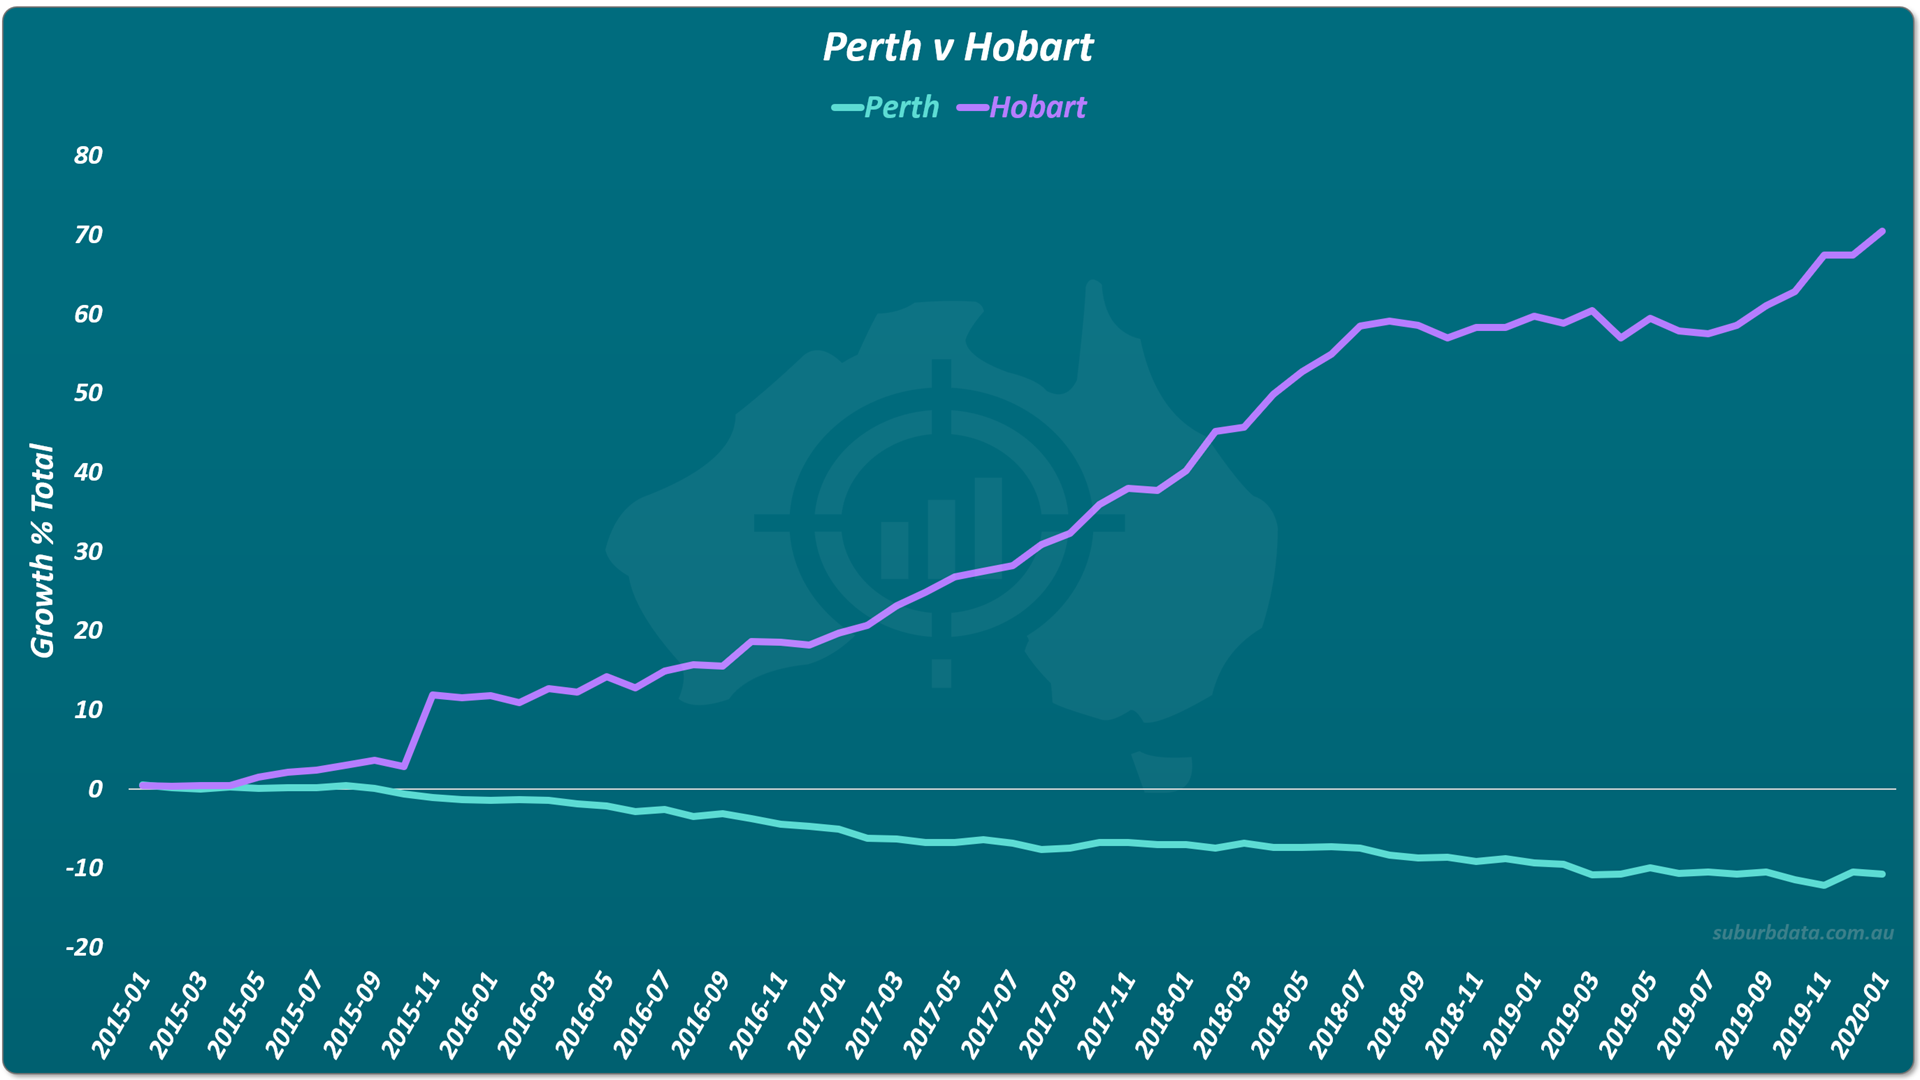
Period: 2015 to 2020
Duration: 5 years
Hobart: plus 70%
Perth: minus 11%
Growth gap: 81%
The opportunity cost dwarfs the reallocation cost.
Brisbane Overtakes Hobart
The chart below shows Brisbane and Hobart from 2020 to 2025.
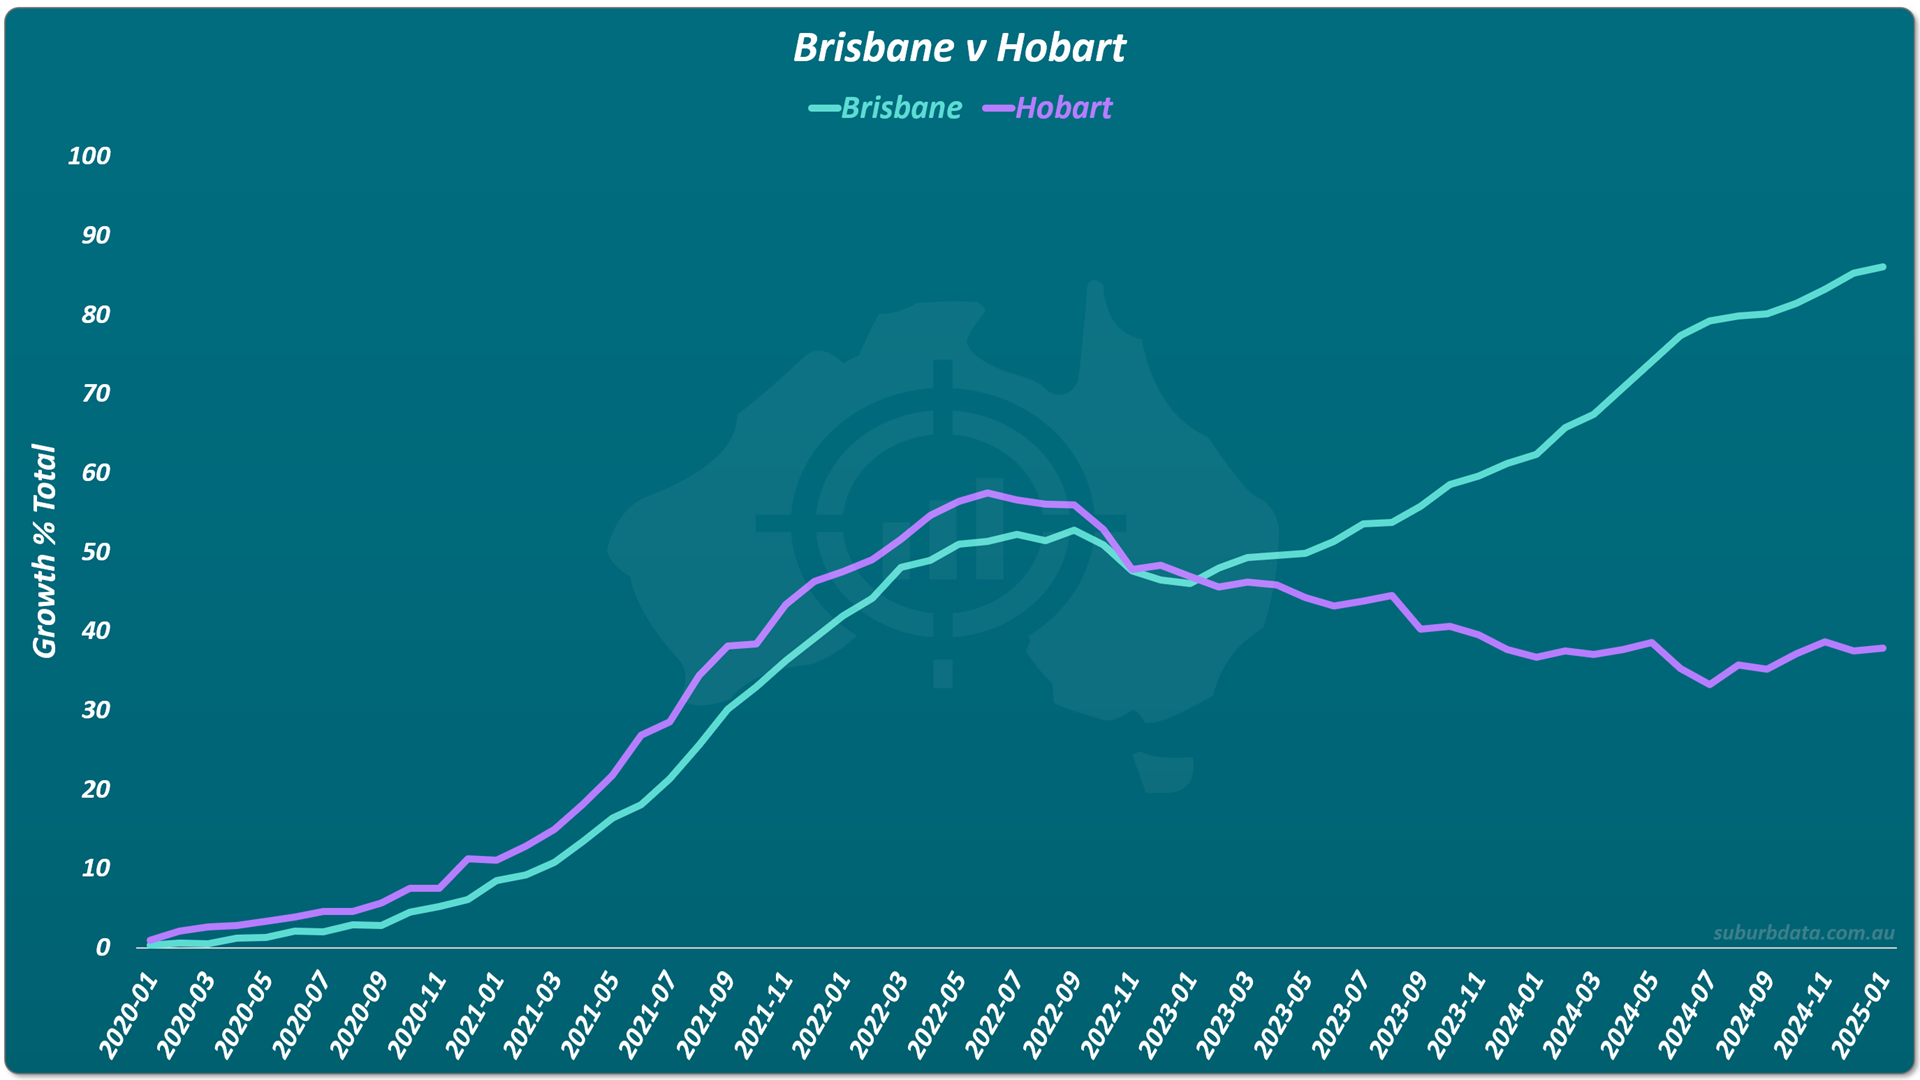
Period: 2020 to 2025
Duration: 5 years
Brisbane: plus 85%
Hobart: plus 38%
Growth gap: 47%
The pattern is consistent. There is always a market in a boom somewhere.
Why Not Just Draw on Equity?
Some say you do not have to sell. Borrow against equity. Buy a second property in the next growth area.
It works for diversification. But it is less profitable.
A significant amount of equity stays in the underperforming market. Once that first boom flattens, equity sits in a doldrum.
The better play: sell out and buy two properties in two different boom areas.
Diversification stays. All equity sits in booming markets.
Why Experts Say Never Sell
If an expert cannot forecast growth, they cannot advise on when to sell.
Without a forecast, holding is the only honest advice. That was true 15 years ago.
Data analysis has changed since. Forecasting capital growth is now feasible.
Holding through long flat periods is inefficient. The opportunity cost is too great to justify hanging on.
When Investors Should Sell
The diagram below summarises the decision.
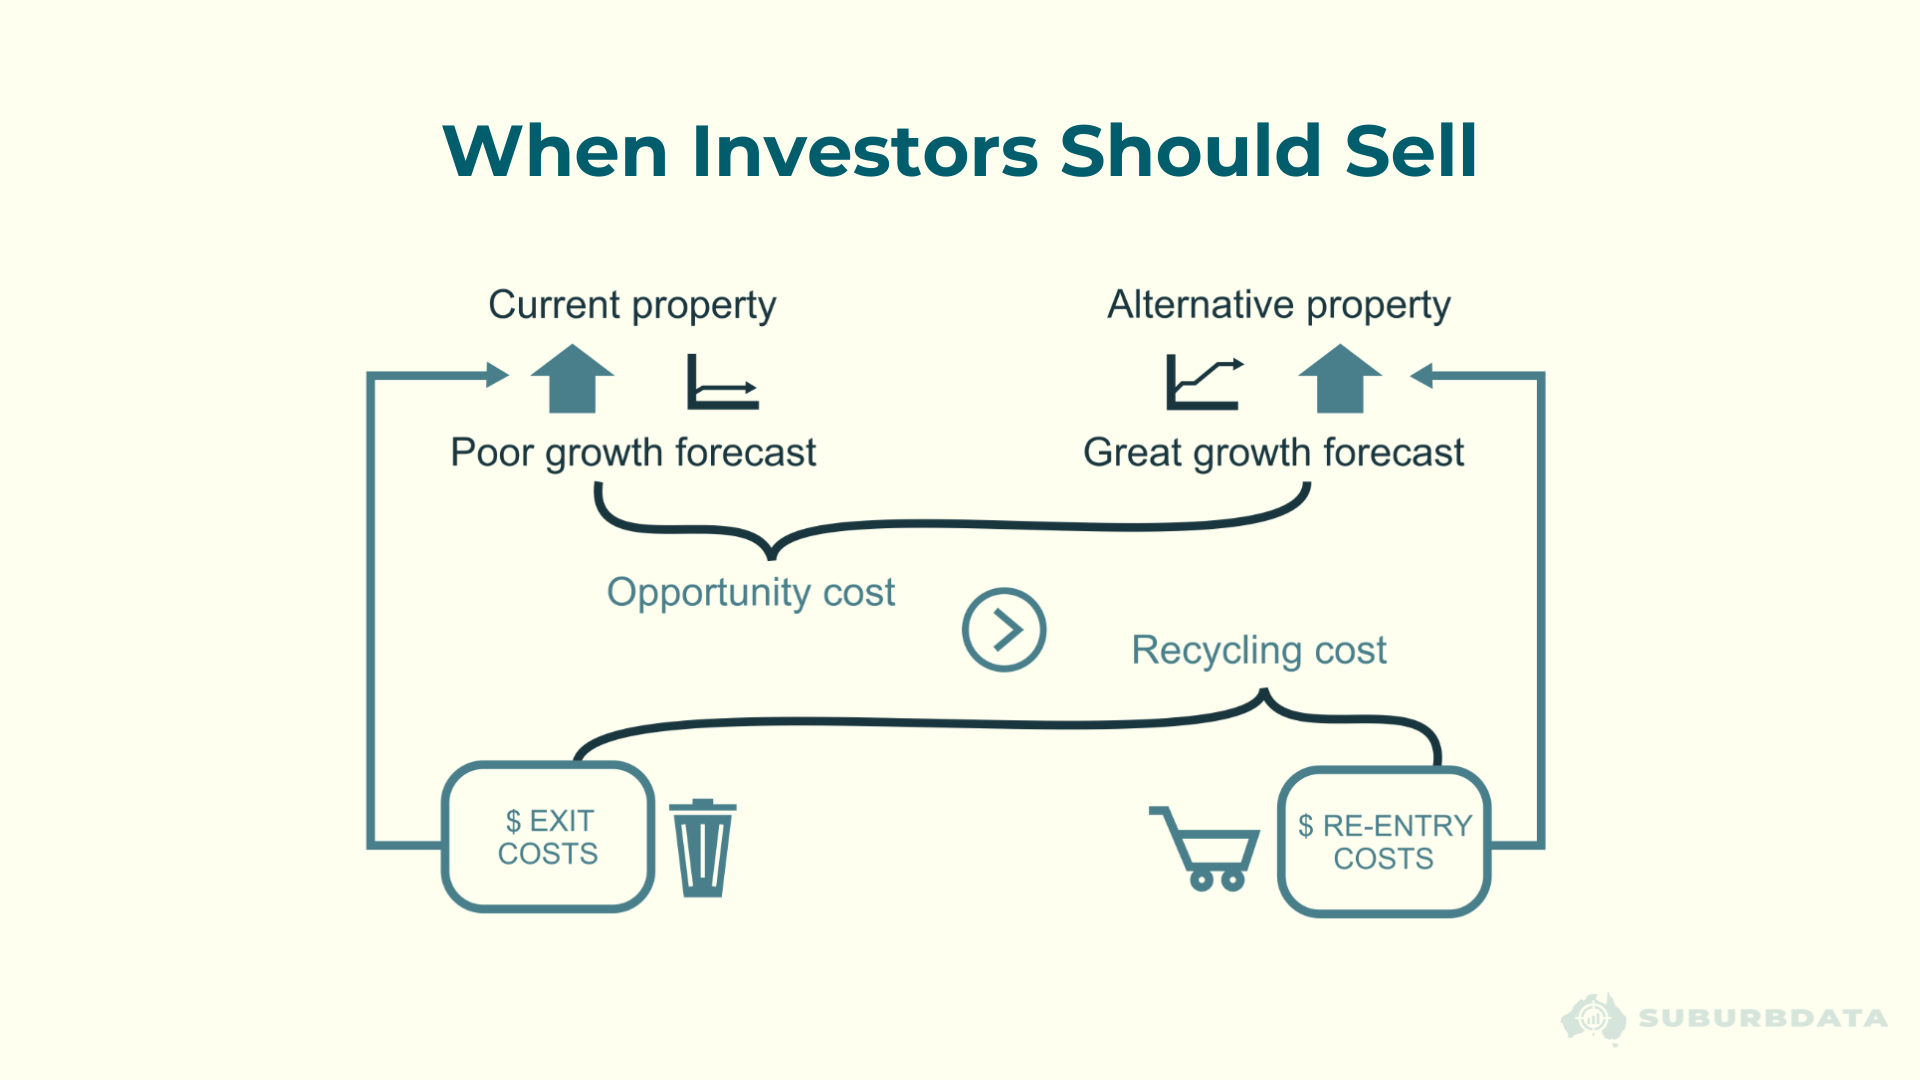
Sell when forecast opportunity cost comfortably exceeds equity reallocation cost.
Hold when it does not.
A property held for 20 years or more is a keeper. CGT alone makes selling unprofitable.
A property bought in the last 10 years, with growth that has levelled out, is the candidate for the trade.
We Are Not Accountants
The CGT figures in this article are ballpark estimates. Not specific tax advice.
CGT varies by ownership vehicle. Personal name, self-managed superannuation fund (SMSF), and trust each have different treatment. CGT laws are in flux at the time of writing.
For a specific estimate, contact an accountant. DPR Chartered Accountants covered ownership vehicles in Suburb Data Podcast episodes 51, 52, and 53.
Conclusion
Buy and never sell was good advice when growth could not be forecast.
It is no longer the best advice. The data age has changed what is possible.
Across 35 years of Australian property data, profitable trades have been common:
- Sunshine Coast traders from 1990 to 2005 made considerably more than holders
- The 2005 Sunshine Coast to Perth trade returned 20% to 25% on top of costs
- The 2015 Perth to Hobart trade captured an 81% growth gap
It does not work every time. The 2010 Perth to Sydney trade lost 2%.
The trade has to be made when the growth opportunity gap is wide enough to comfortably exceed the equity reallocation cost.
For more on the historical case for trading, see EBS 13, Time In versus Timing.