

Some investment experts claim a suburb with 65% to 70% owner-occupiers is the ideal market for an investor. Too many renters and the suburb suffers. Too few and renters apparently do not like the area.
The claim has been repeated for a decade without evidence. We have the evidence. The experts have been wrong.
The Claim
Here is the claim in the words of one such expert:
"...if the market is made up of 65%-70% owner-occupiers then this is the ideal market to attract when it comes time to sell."
Let’s define some terms:
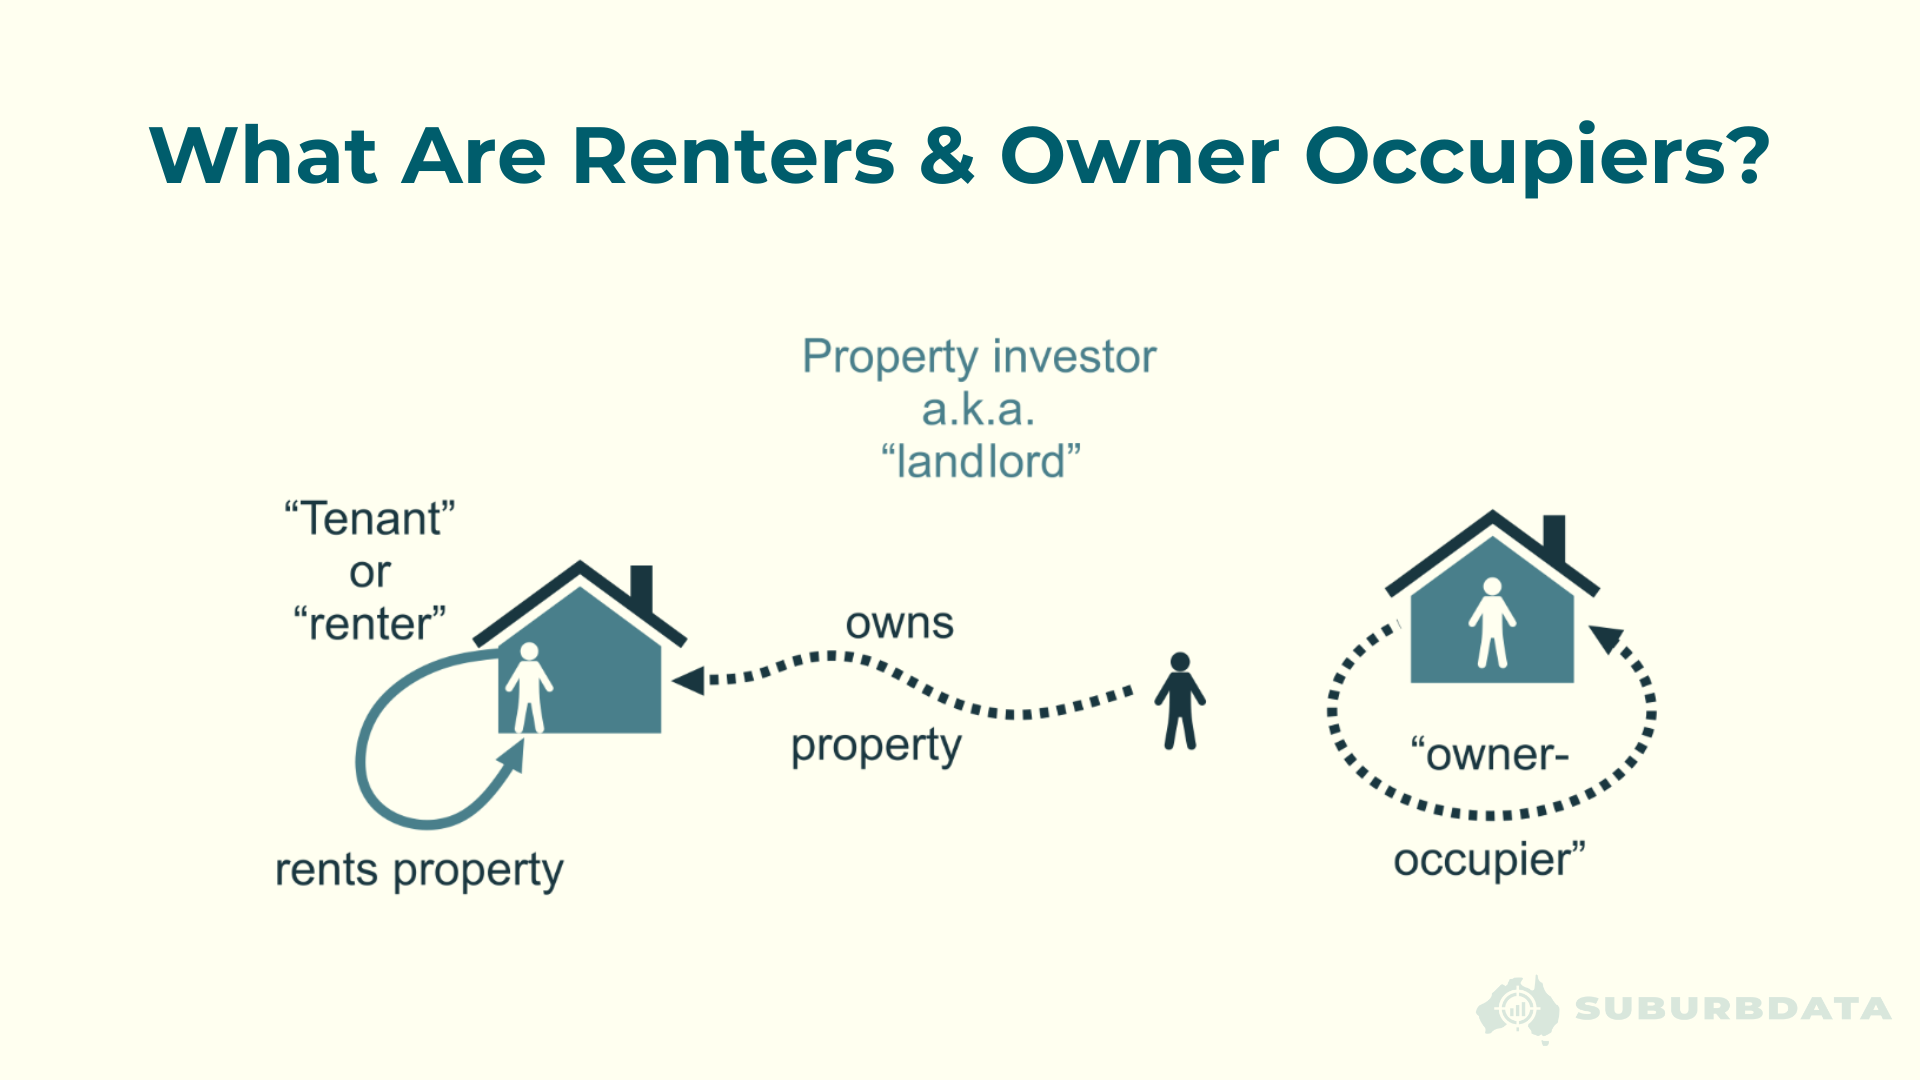
The logic runs as follows. Too many renters means landlords and tenants do not look after properties as well as owner-occupiers, so growth suffers. Too few renters means tenants do not like the area, so the suburb is risky to rent out.
The conclusion is that there must be a sweet spot in the middle.
There is no data behind the claim. It has been repeated for years because in this industry, marketing yields more revenue than research. Opinions are in oversupply.
Four Censuses, 3,800 Suburbs
The proportion of renters in a suburb is the share of residents who rent rather than own.
The diagram below shows how it is calculated.
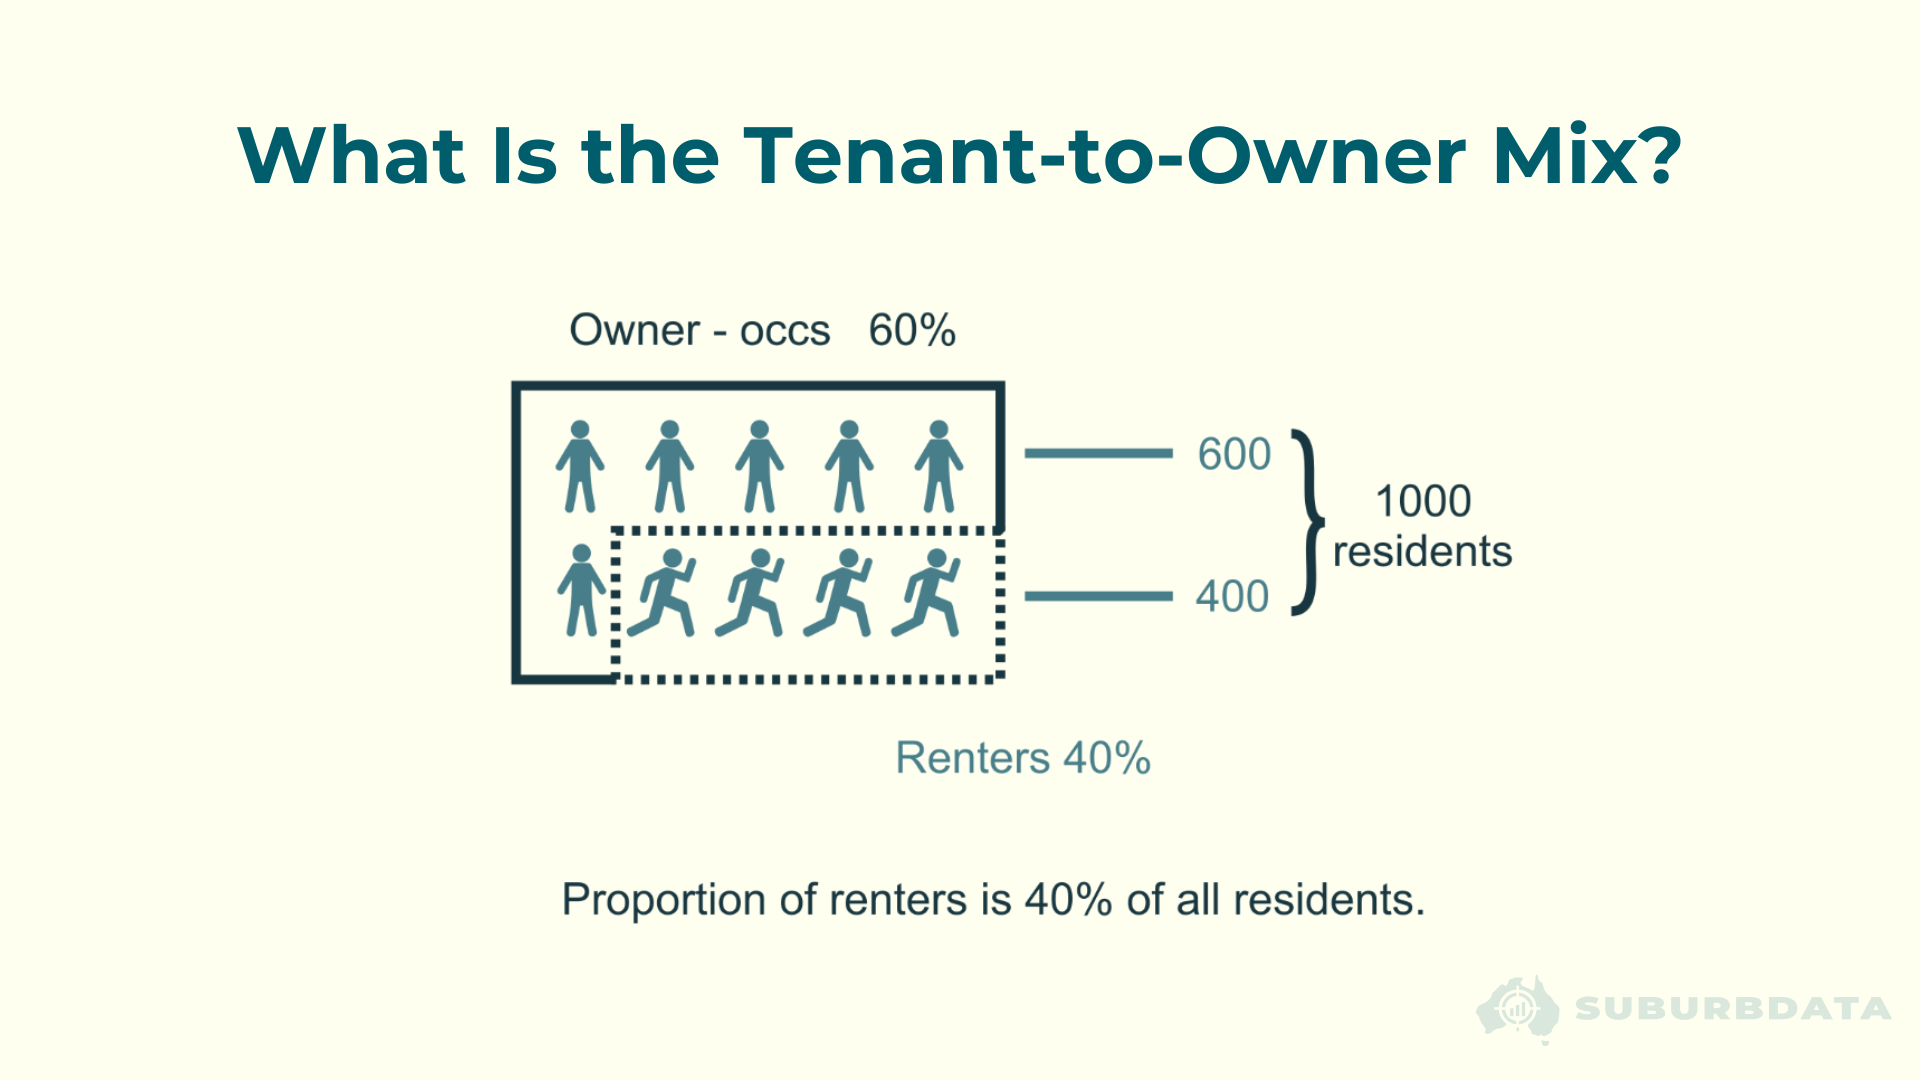
The national long-term average sits at about 30% renters. About 1 in 3 properties is owned by an investor. The proportion varies significantly between suburbs.
Renters Measure Supply, Not Demand
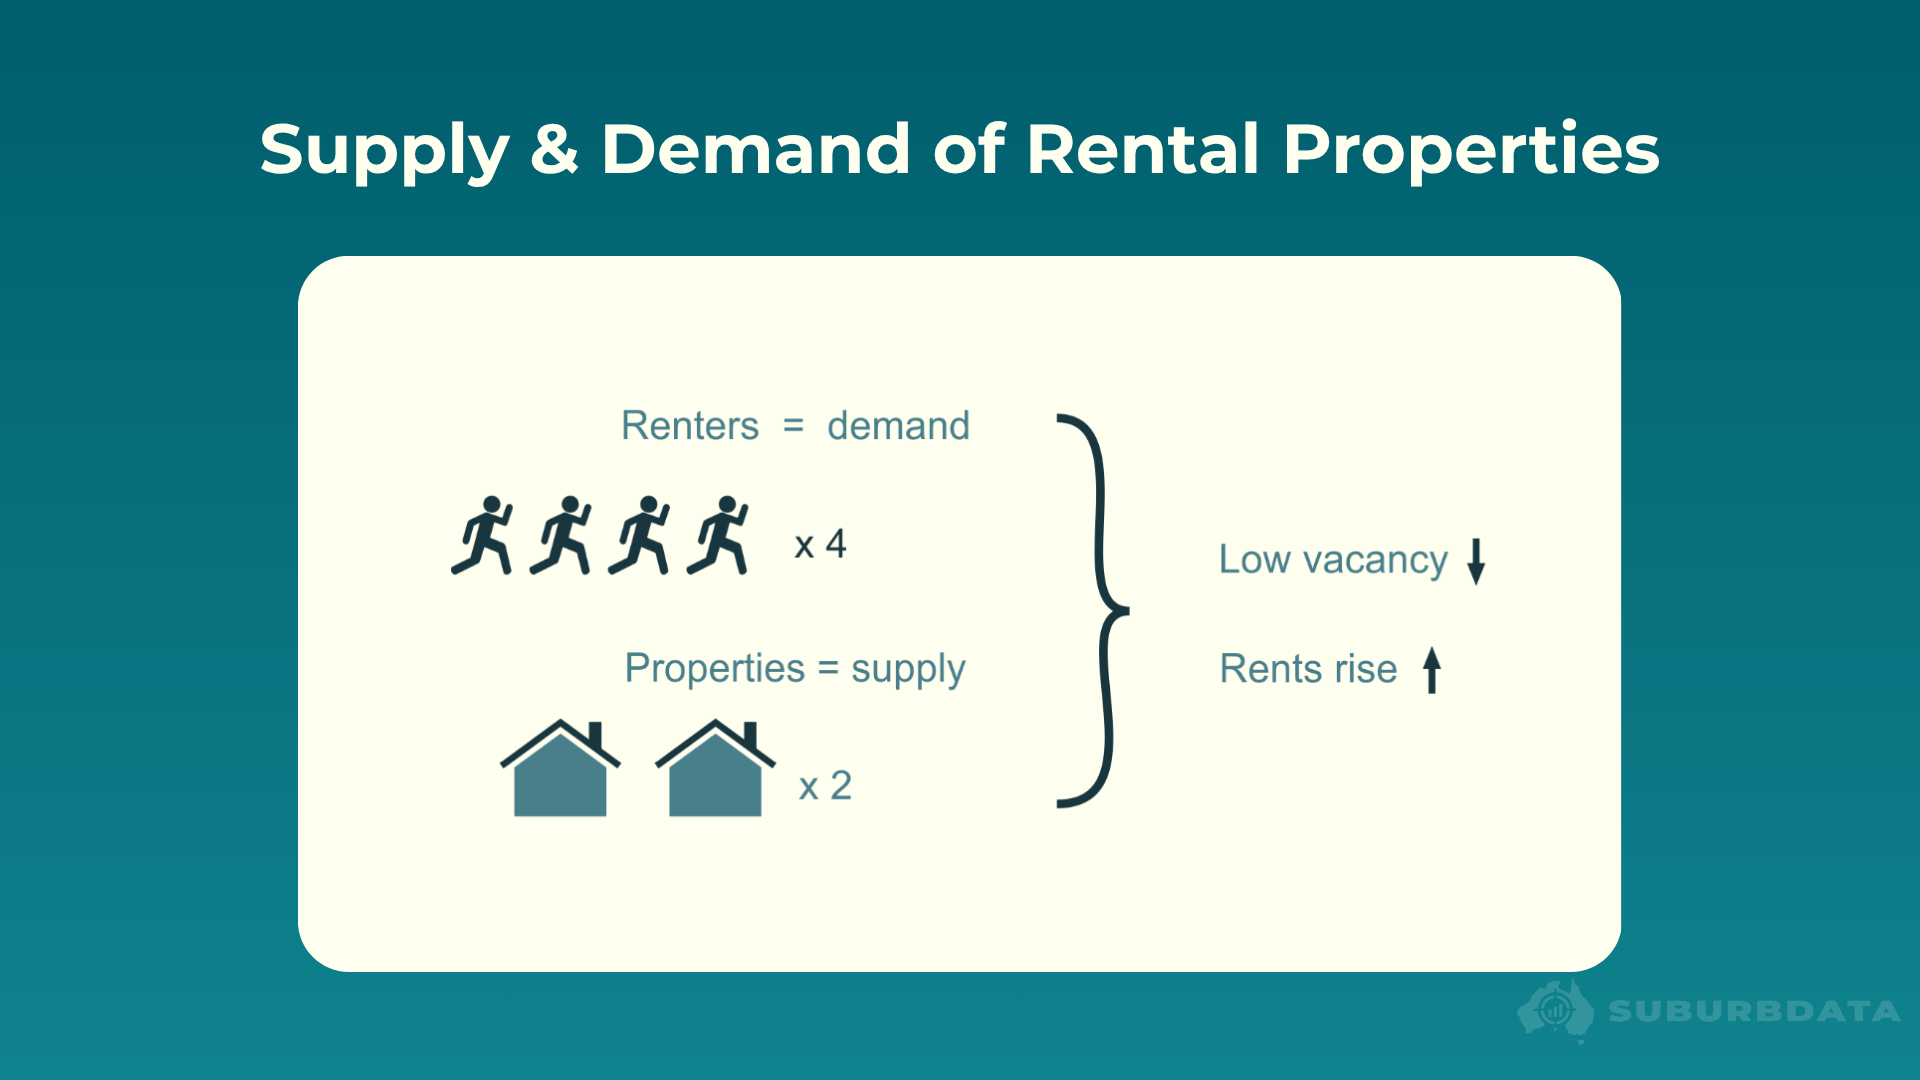
The proportion of renters is a supply indicator. Some experts treat it as a demand indicator.
The diagram below shows the correct framing.
Why would owner-occupiers buy and live in a suburb? Quiet streets, low crime, good schools, shops, transport, parks.
Are any of those reasons a tenant would NOT want to live there?
Tenants are humans. They want the same things owner-occupiers want. A low proportion of renters in a suburb does not mean tenants dislike the area. It means there are not many rentals available.
The diagram below shows the scenario an investor actually wants.
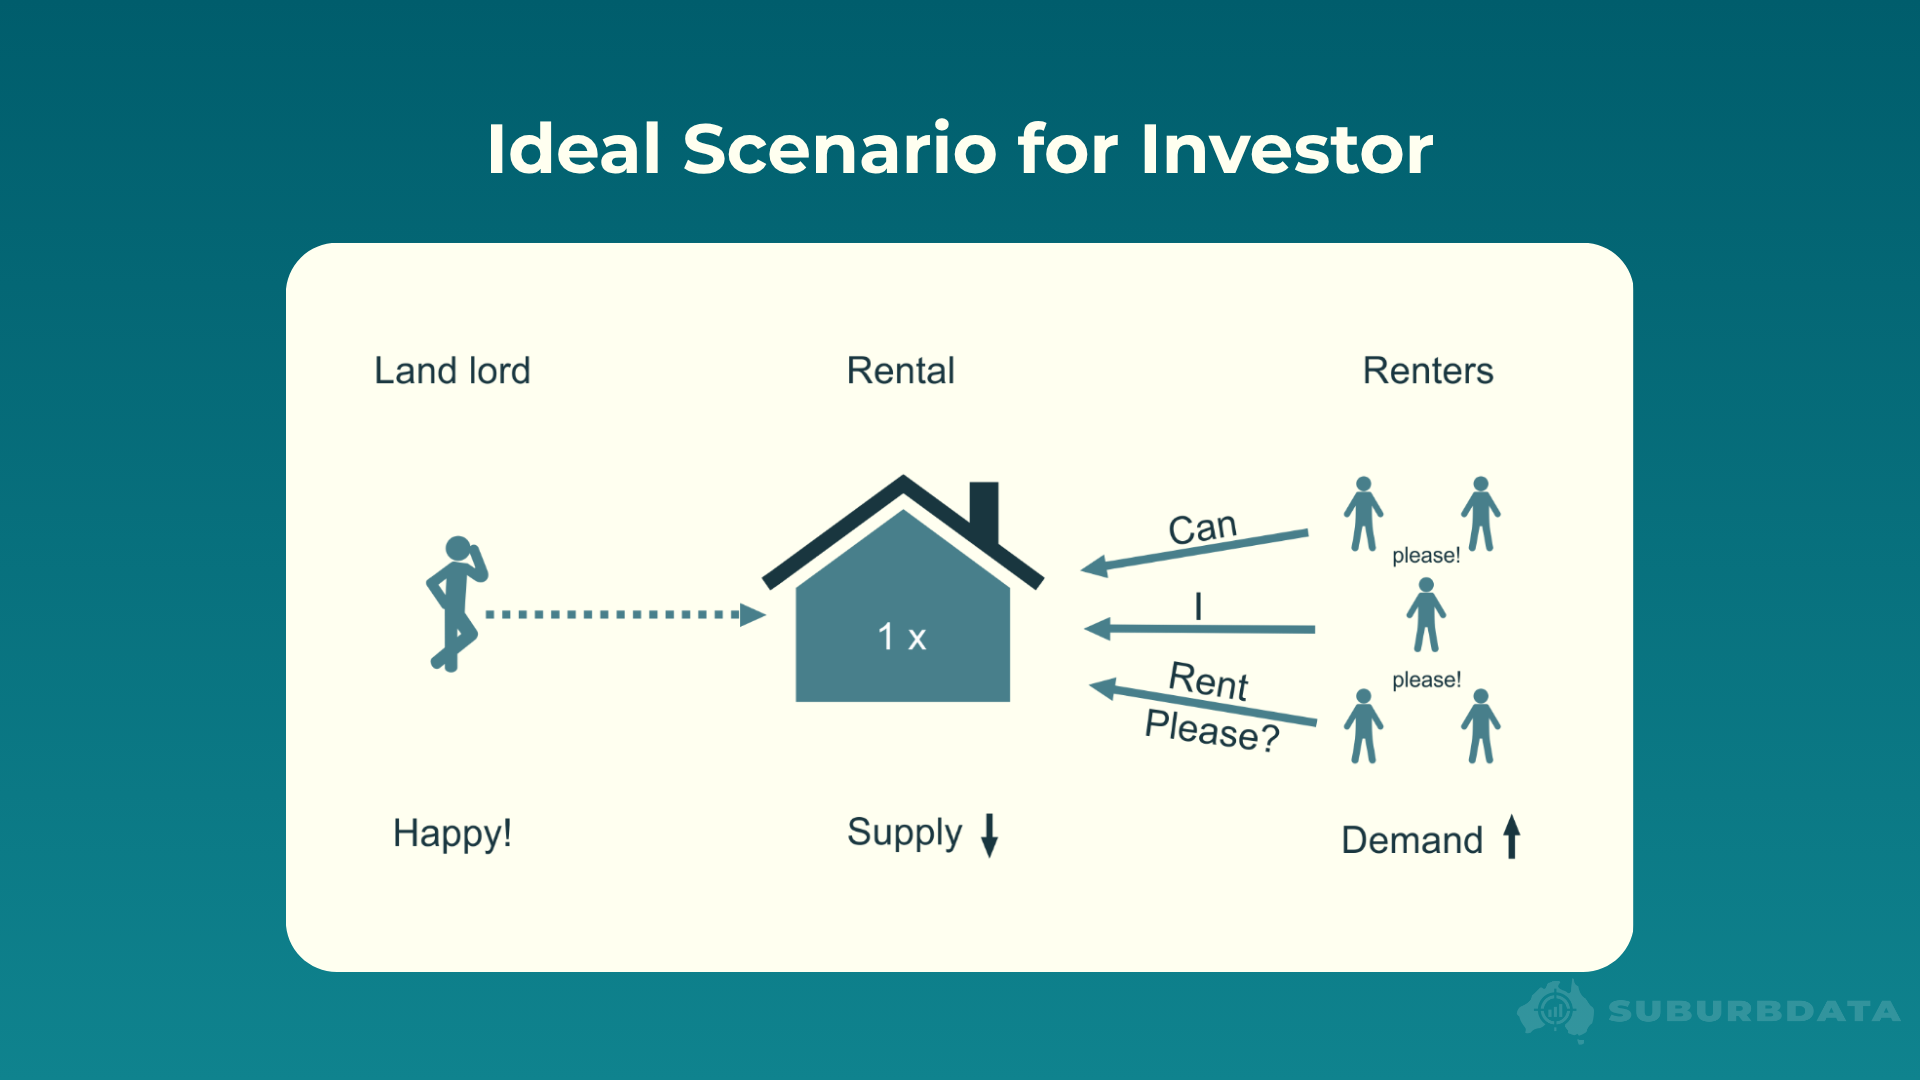
An investor wants the proportion of renters as close to zero as possible. No competition from other landlords. Tenants scrambling for the only rental in the suburb.
The experts' "ideal" of 30% to 35% renters is the opposite of what an investor wants.
This is the error EBS 32, Information Overload, warned about: treating a supply indicator as a demand indicator. The proportion of renters is one of the clearest examples in the industry.
Renters vs Growth
Let’s see what the data has to say. The data comes from the Australian Bureau of Statistics (ABS) census. We have four measurements: 2006, 2011, 2016 and 2021. For the analysis that follows, we used the first three. The 2021 data has not yet had five years of forward growth to pair with at the time of writing.
We grouped about 3,800 suburbs from significant urban areas with populations of at least 50,000 into ten deciles by proportion of renters. Decile 1 contains the lowest-renter suburbs. Decile 10 contains the highest.
Each decile has the same number of suburbs.
The chart below pairs the proportion of renters in each suburb at each measurement with the 5-year growth in property values that followed.
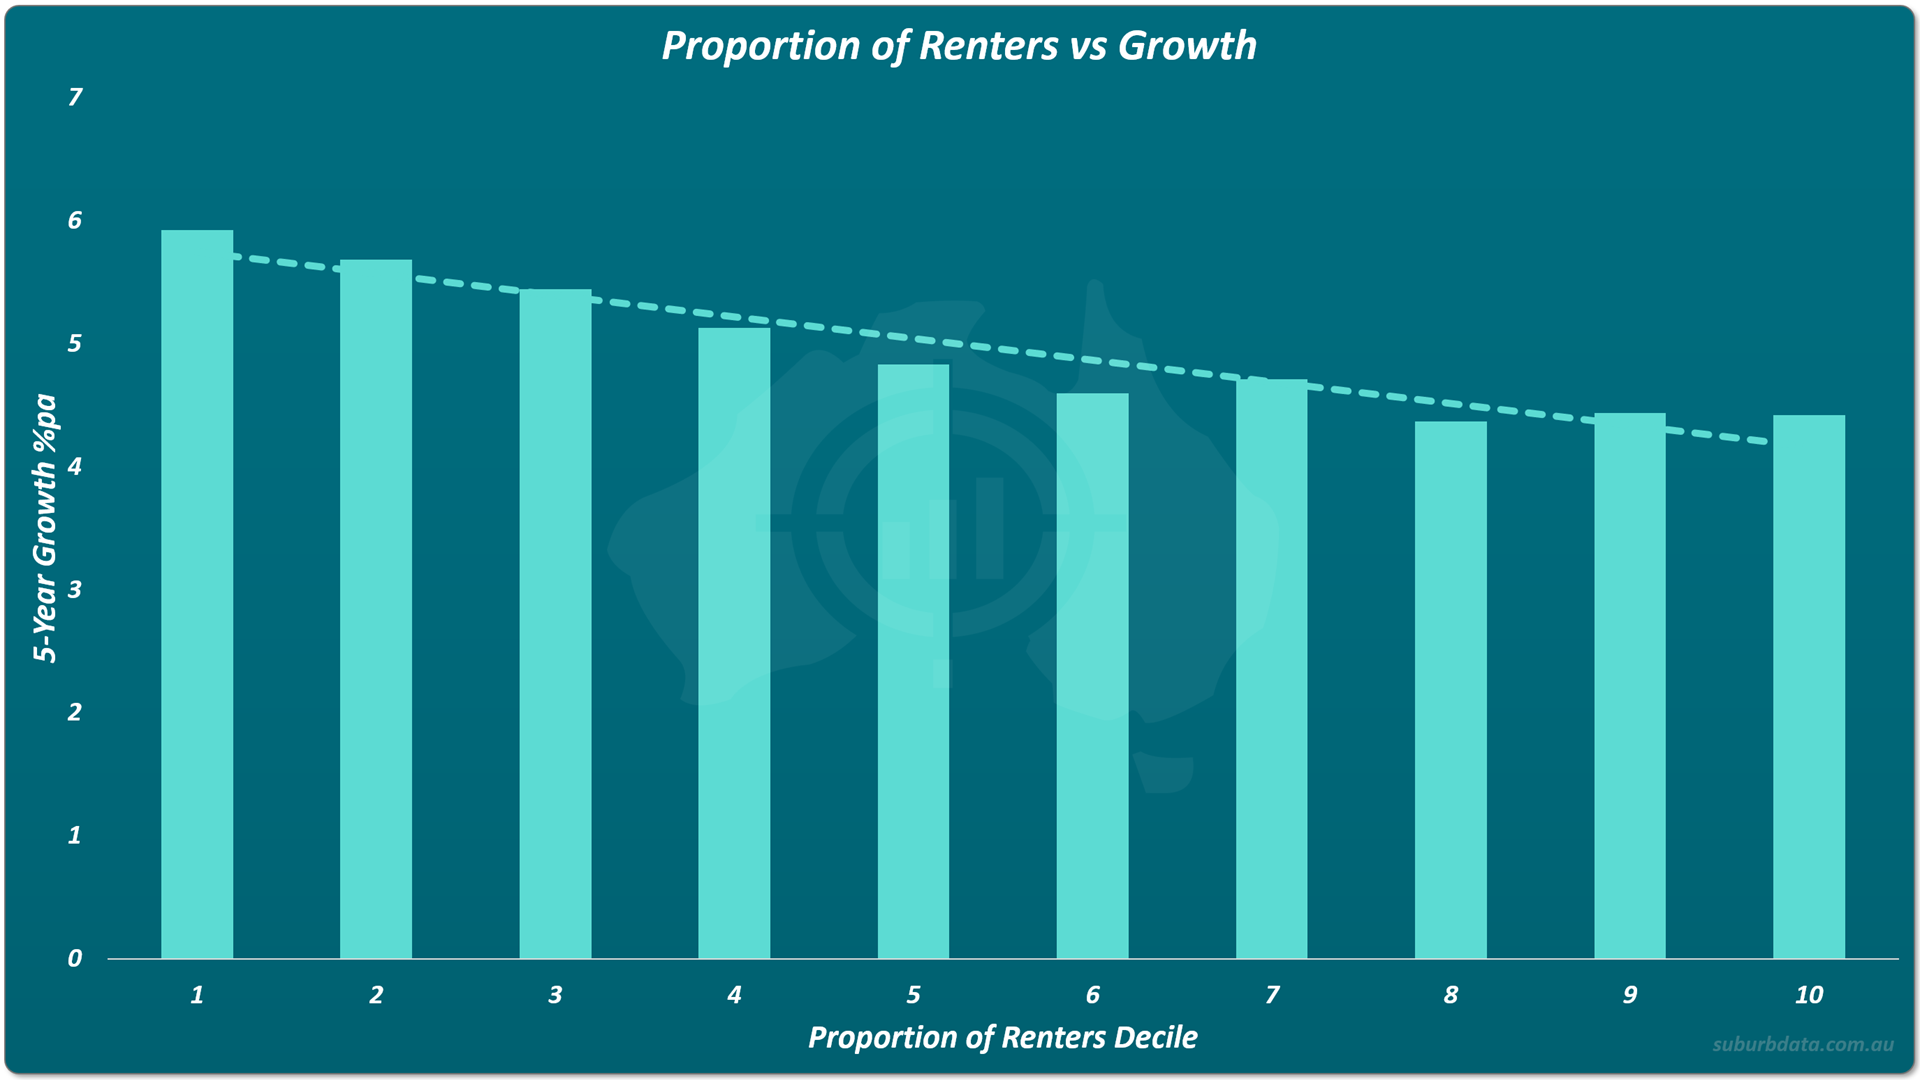
The trend is continuous. The lowest-renter decile averaged 5.9% pa growth. The highest-renter decile averaged 4.4% pa. The gap is about 1.5 percentage points per annum.
Over five years, compounded, that gap is substantial.
There is no sweet spot in the middle. The best growth is on the far left. The experts' recommended range of 30% to 35% renters sits in the middle of the chart, where growth is mediocre.
Supply is the enemy of capital growth. A suburb with a high proportion of renters has a high proportion of rental supply. Growth suffers.
Renters vs Yield
The same analysis for yield tells a different story. There is no story.
The chart below pairs the proportion of renters with rental yield.
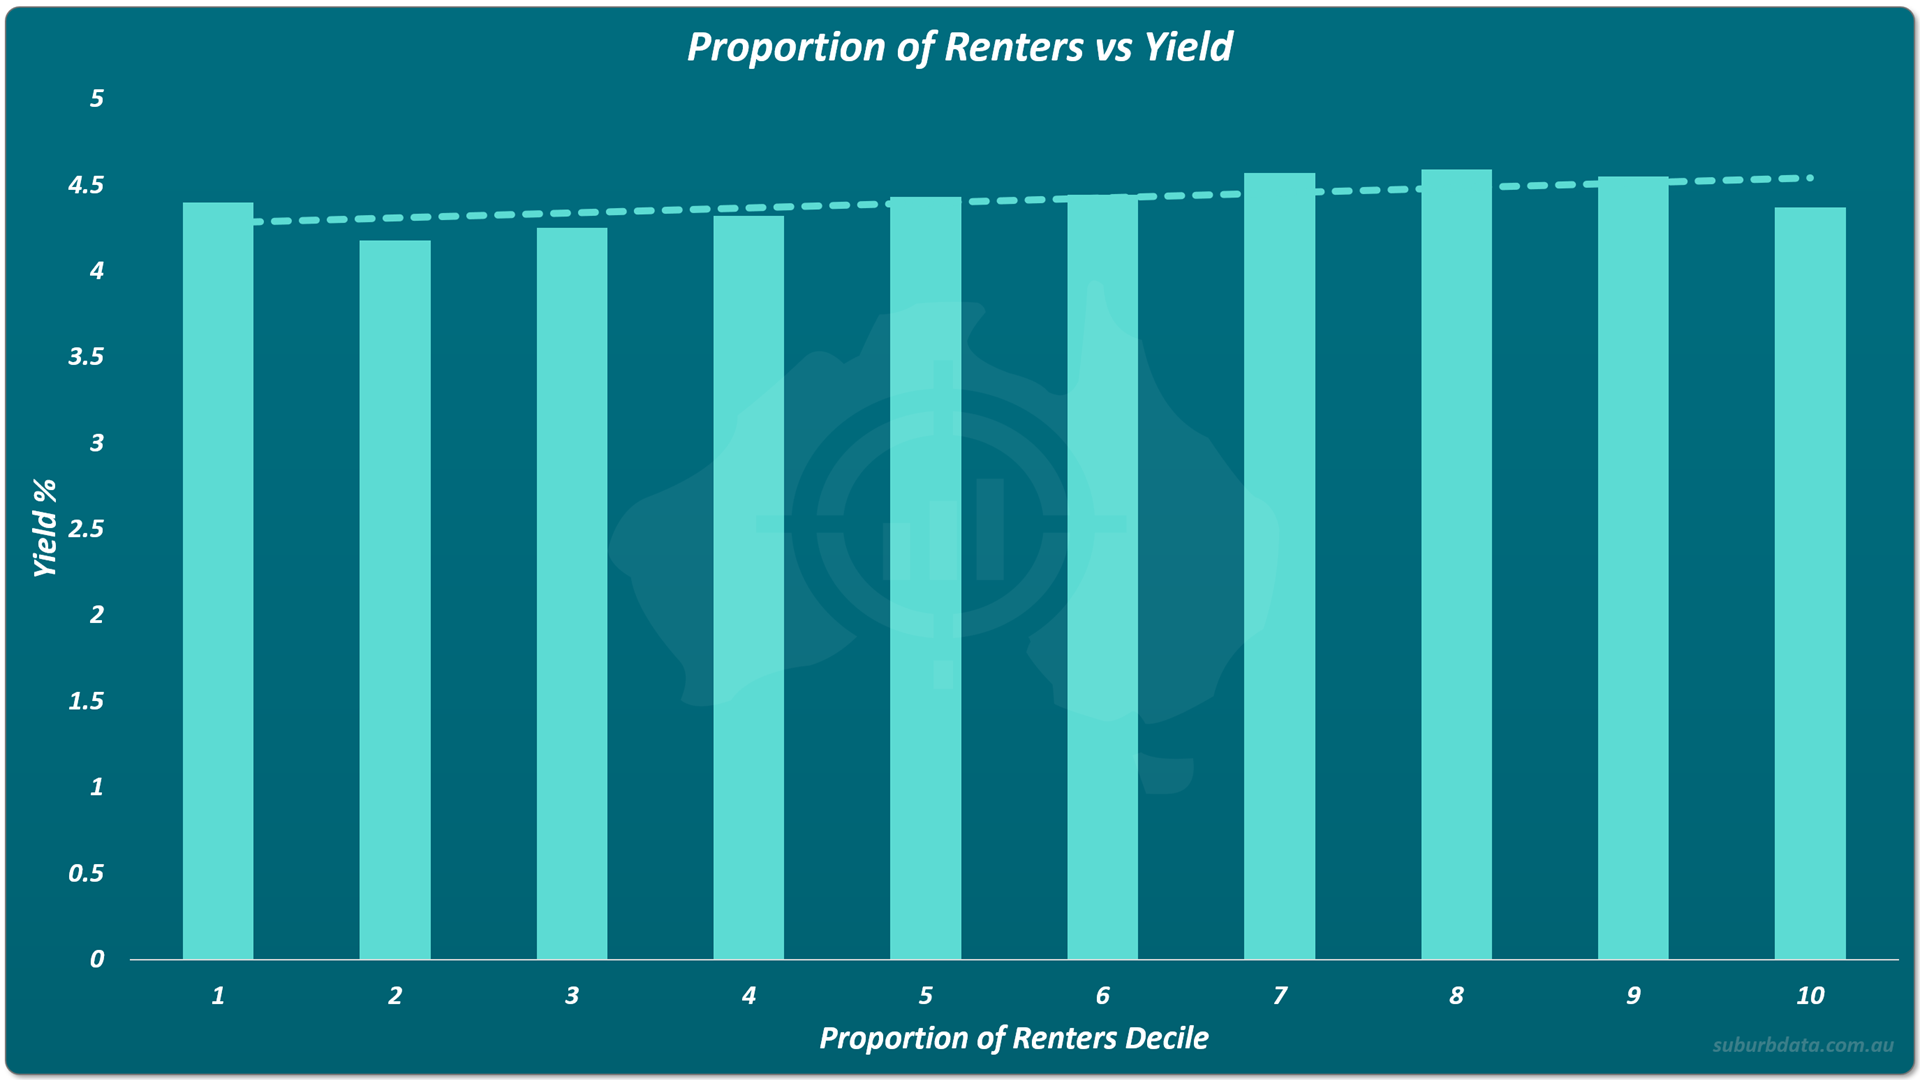
The trend line rises by about 0.1% across all ten deciles. Minor wobbles between deciles are noise, not signal.
Yield does not vary meaningfully with the proportion of renters. Whatever experts might claim about high-renter suburbs delivering better income, the data does not support it.
Renters vs Vacancy
Vacancy is the messiest of the three charts.
The chart below pairs the proportion of renters with vacancy rate.
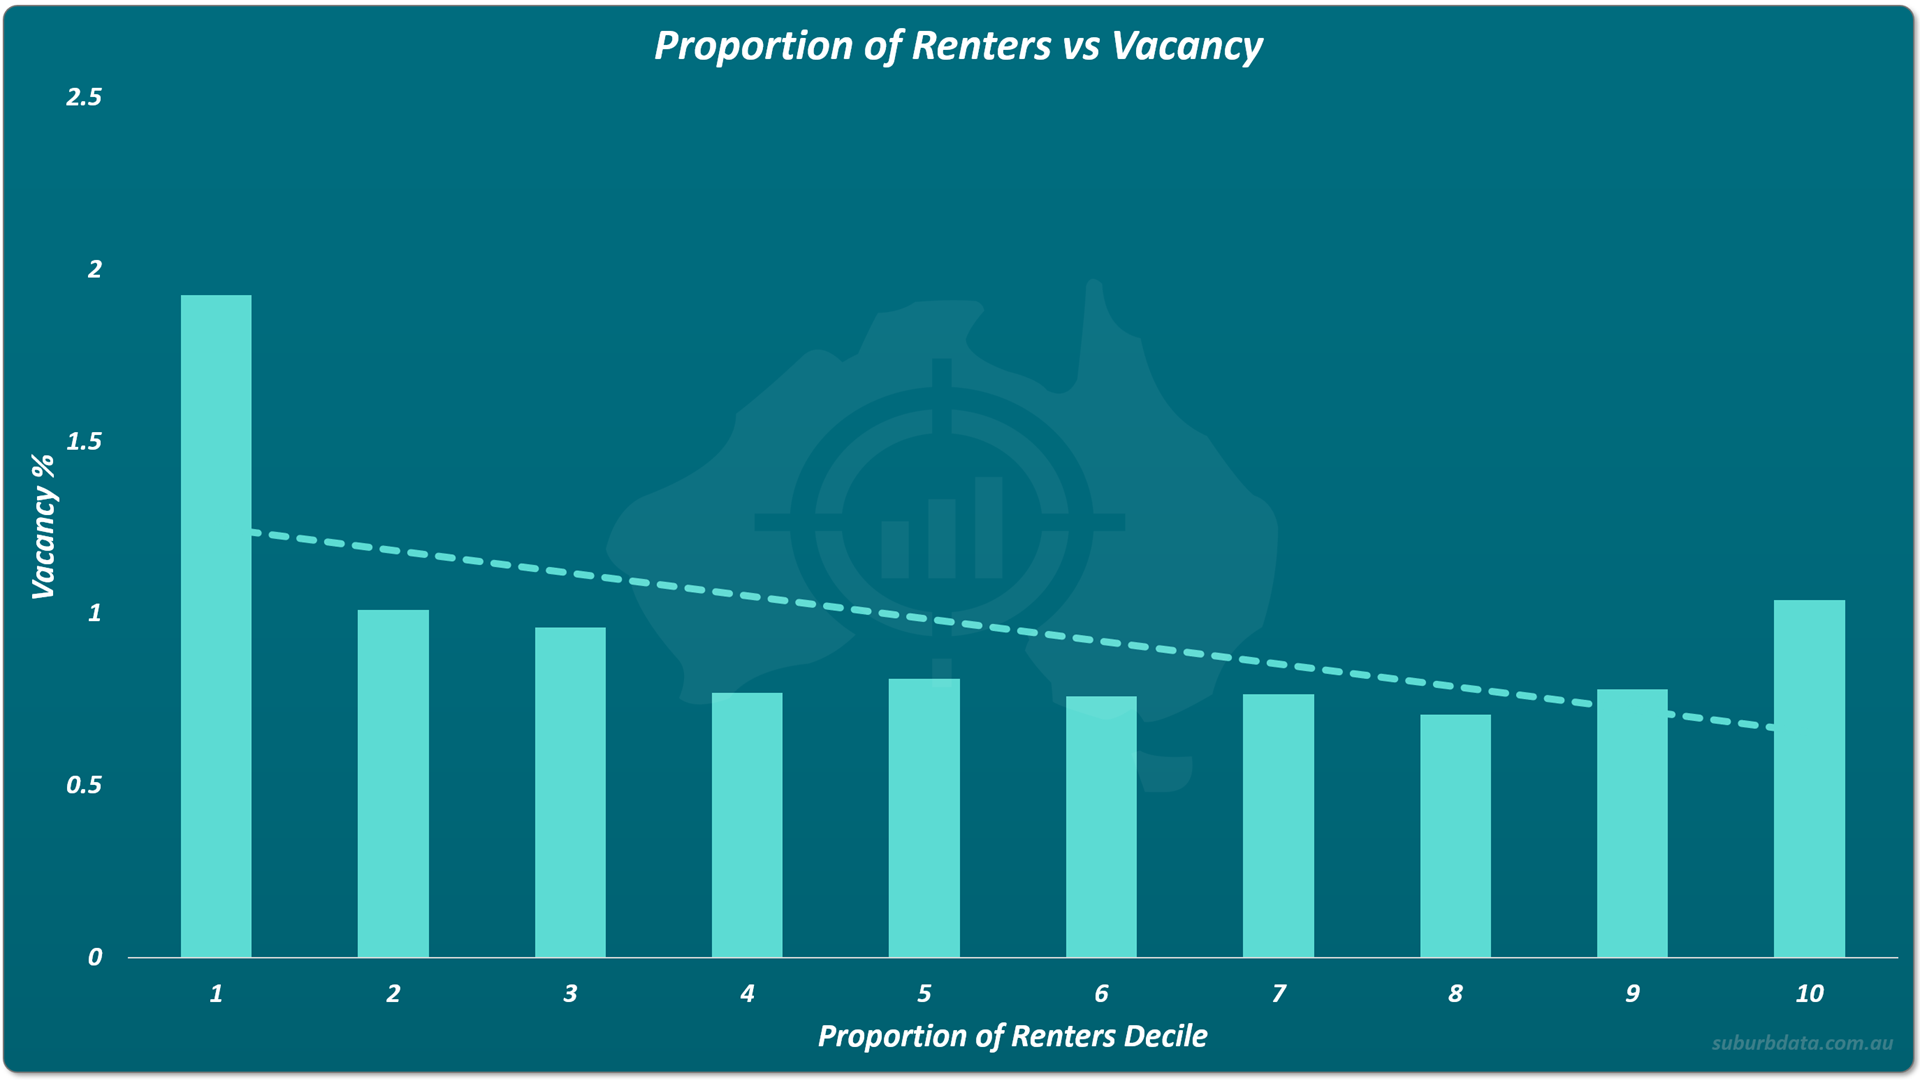
Decile 1 looks alarming at 1.9% vacancy. It is a measurement artefact.
Consider a suburb of 1,000 dwellings where 5% are rented. That is 50 rental properties. One vacant rental gives a 2% vacancy rate. Two gives 4%. Single properties move the measure dramatically. The metric becomes unstable when the denominator is small.
Decile 1 should be written off as unreliable.
Among the remaining deciles, the trend is gentle. Higher renter proportion correlates weakly with lower vacancy. But the chart is not clean. Decile 2 and decile 10 sit at the same level. The lowest vacancy is at decile 8.
Even if the chart is taken at face value, the "sweet spot" for vacancy is at decile 8. That is nowhere near the experts' decile 4 or 5.
Conclusion
The ideal proportion of renters is zero. It is a supply metric, there is no sweet-spot.
Few renters in a suburb means few rentals on offer. That is the position an investor wants.
The conventional 65% to 70% owner-occupier "ideal" puts an investor in the middle of the pack on growth, in the middle of the pack on yield, and nowhere near the lowest vacancy.
Capital growth is the ant's pants of property investing. The growth chart settles the question on its own.