

You may have heard the old adage: the three most important things in property investing are location, location, location. The idea is that if you find the right location, you are set. You cannot change the location of a property once you have bought it, so you need to get it right at purchase.
Historical data tells a different story. The three most important things in property investing are timing, timing, timing.
It does not matter so much where you buy. It matters when you buy there.
Time Levels Out
The diagram below shows how two property markets compare over the short term and the long term.
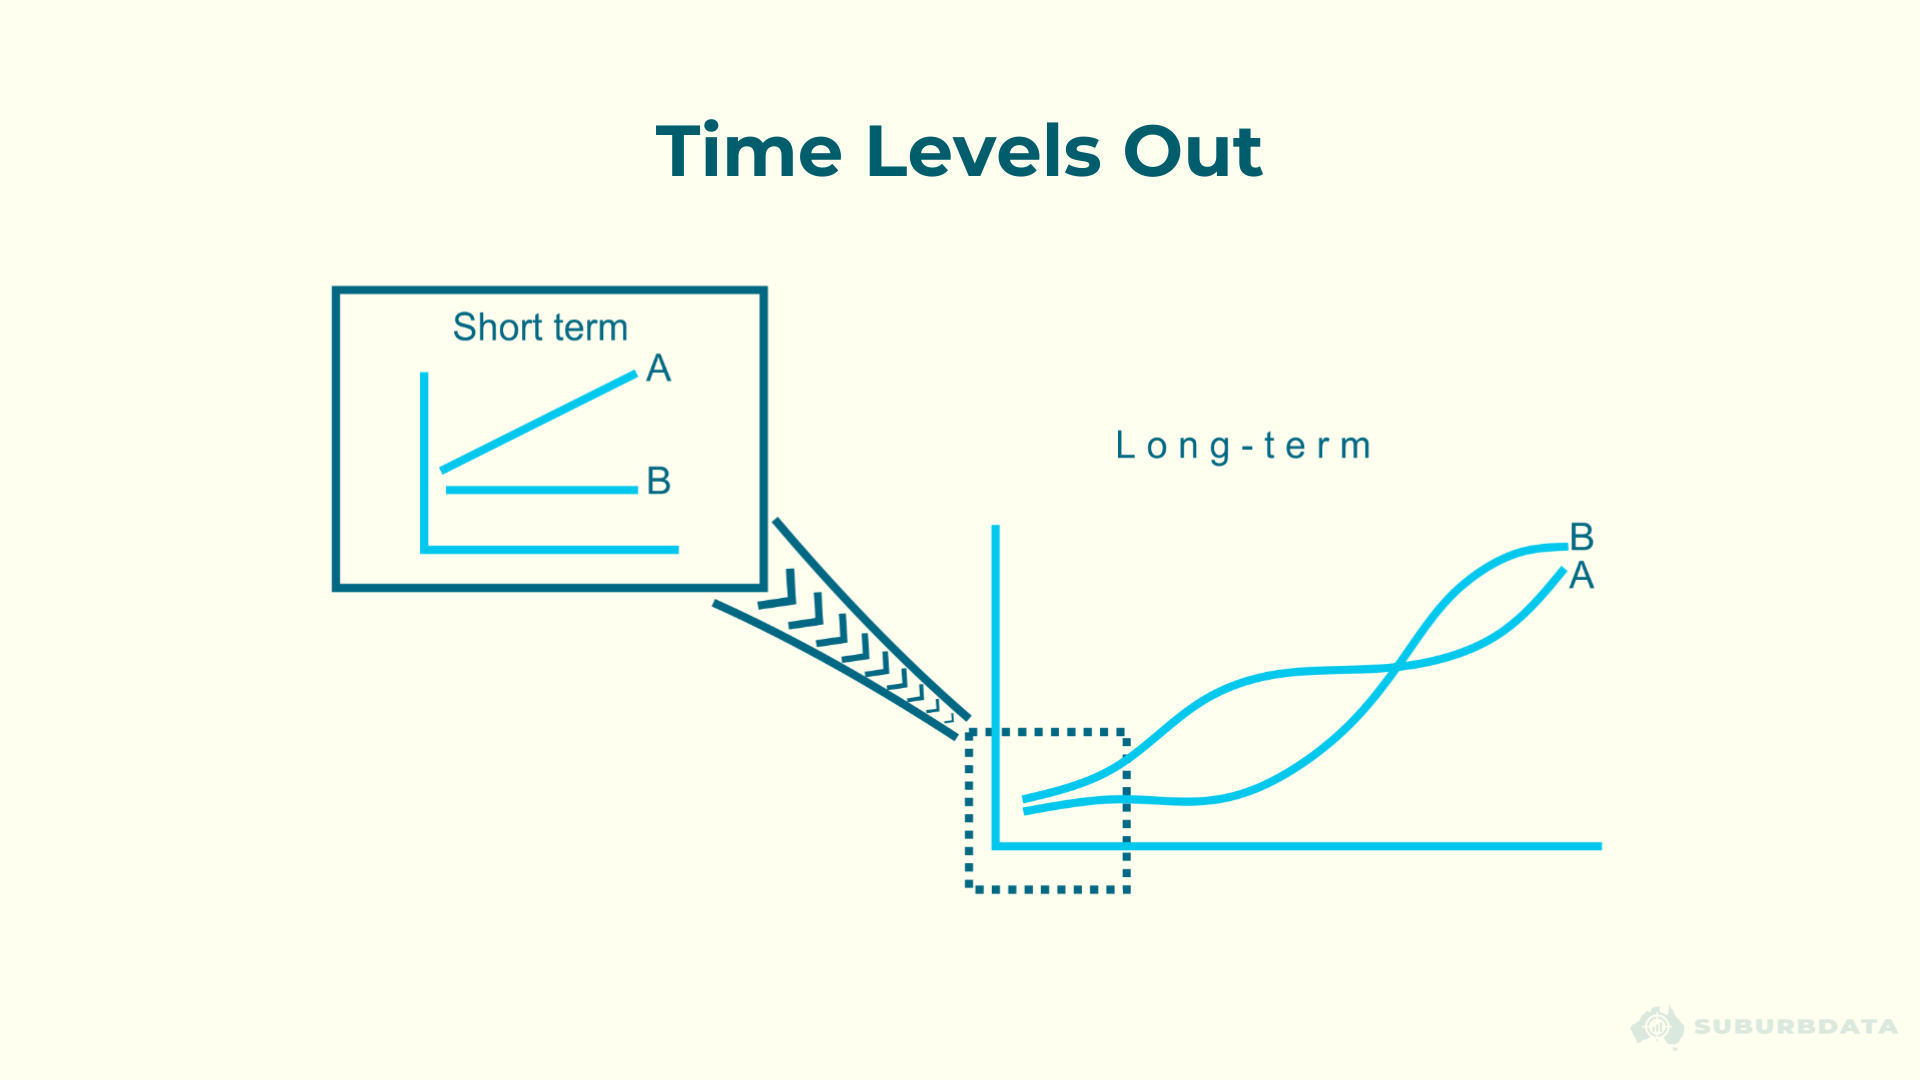
If location was the dominant factor, good locations would get further ahead of poor ones over time. The gap between them would widen.
It does not happen. The longer the timeframe, the more likely two properties in the same suburb end up with very similar results. It is the same for two suburbs in the same city. Two cities, the same. Over the long term there is a tendency for all property to grow at the same rate.
The radical differences happen over the short term.
The Short-Term Lead Keeps Swapping
The chart below shows growth in Sydney, Melbourne, Brisbane and Perth over the 5 years from 1990 to 1995.
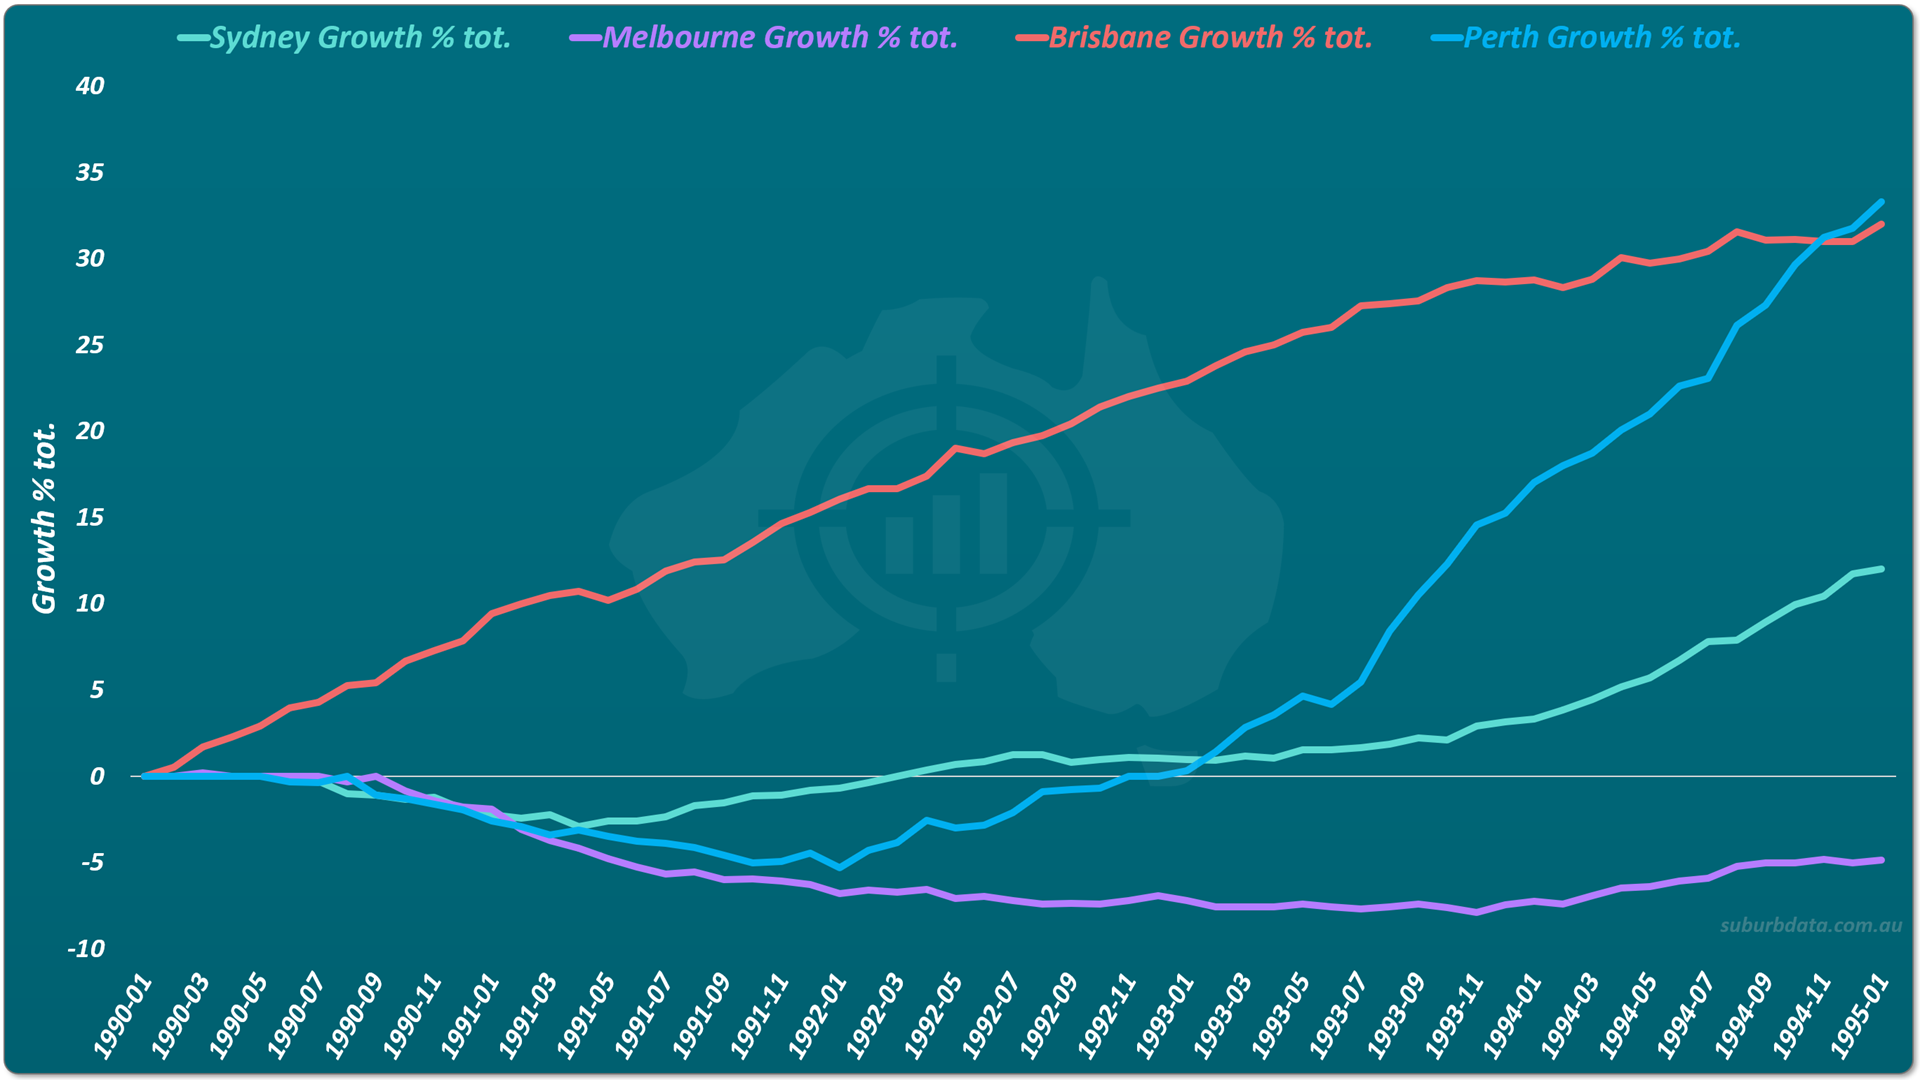
Brisbane and Perth had decent growth. Sydney and Melbourne were weak. The gap between top and bottom was over 30%, which in today's terms is hundreds of thousands of dollars.
The chart below shows the same cities over the next 5 years, 1995 to 2000.
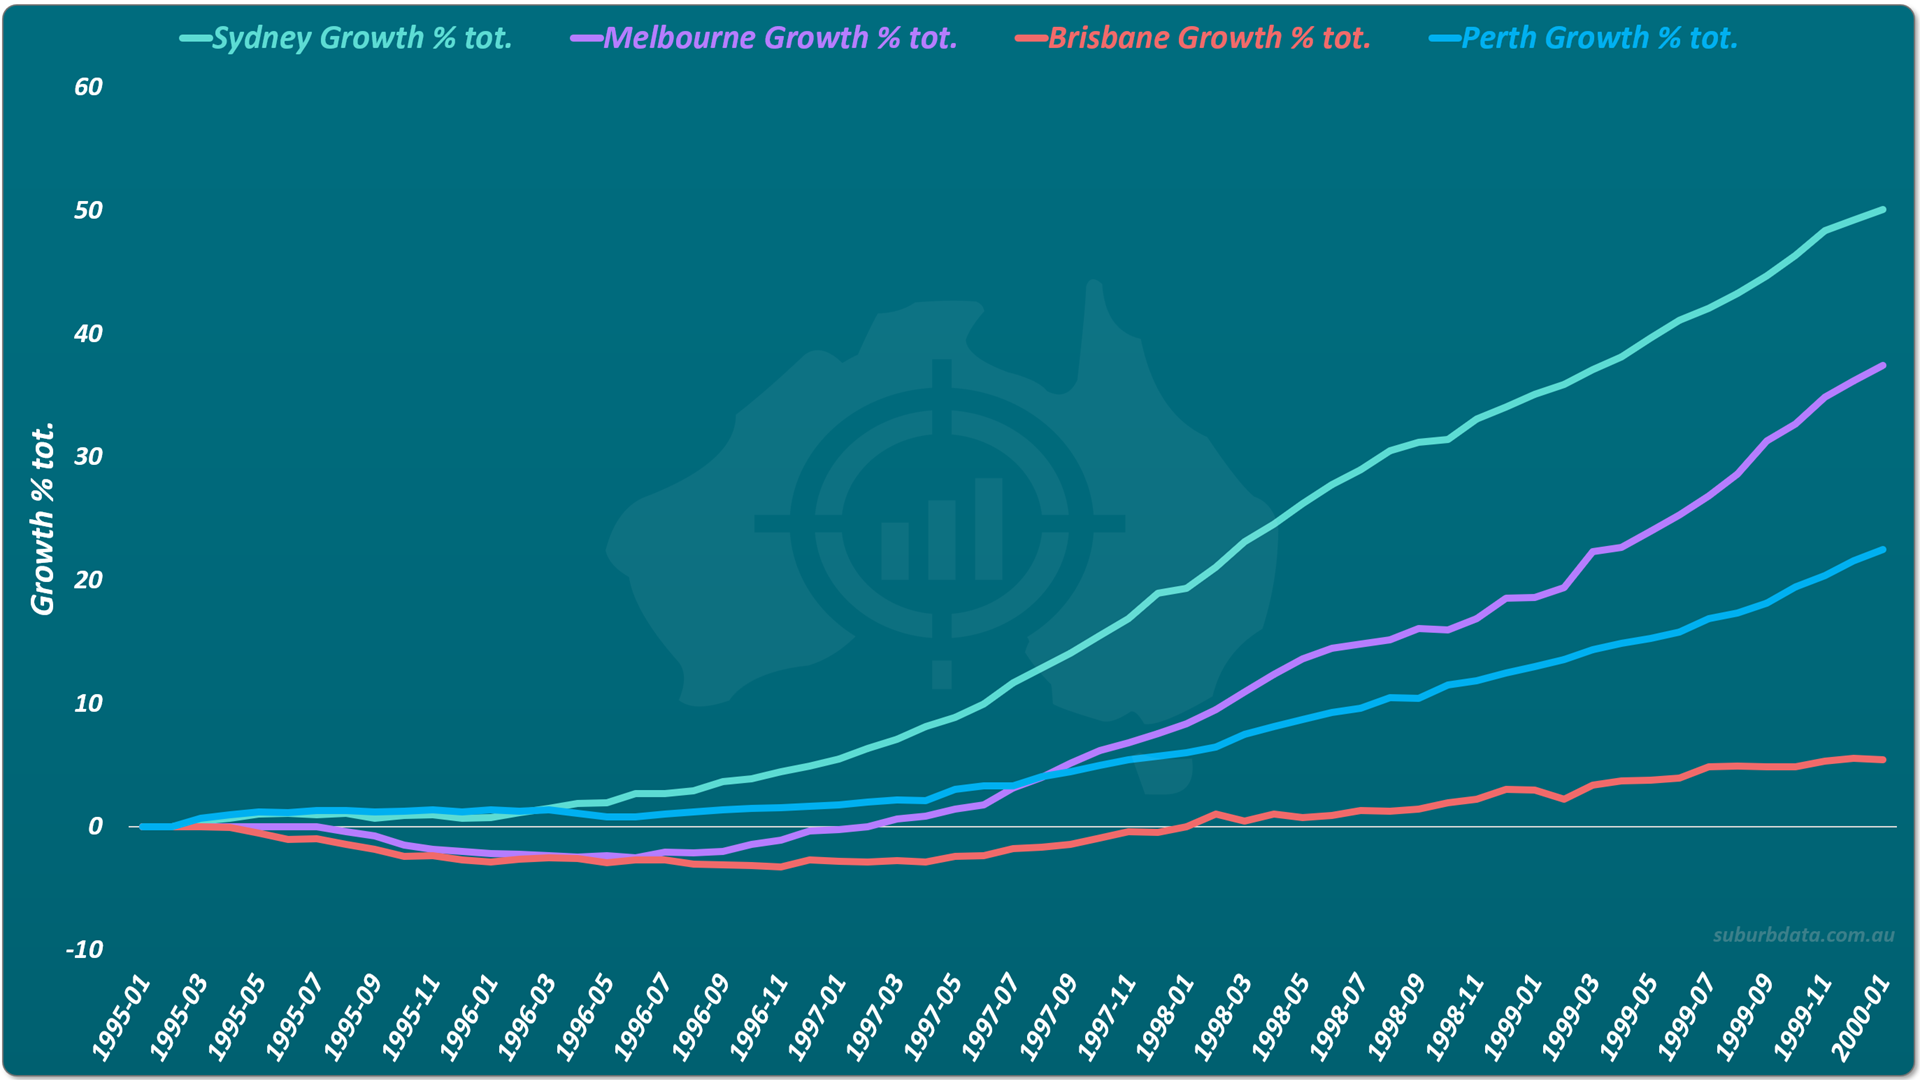
Sydney and Melbourne are now at the top. Brisbane and Perth underperform. Another gap worth hundreds of thousands of dollars.
The chart below shows the same cities over the next 5 years, 2000 to 2005.
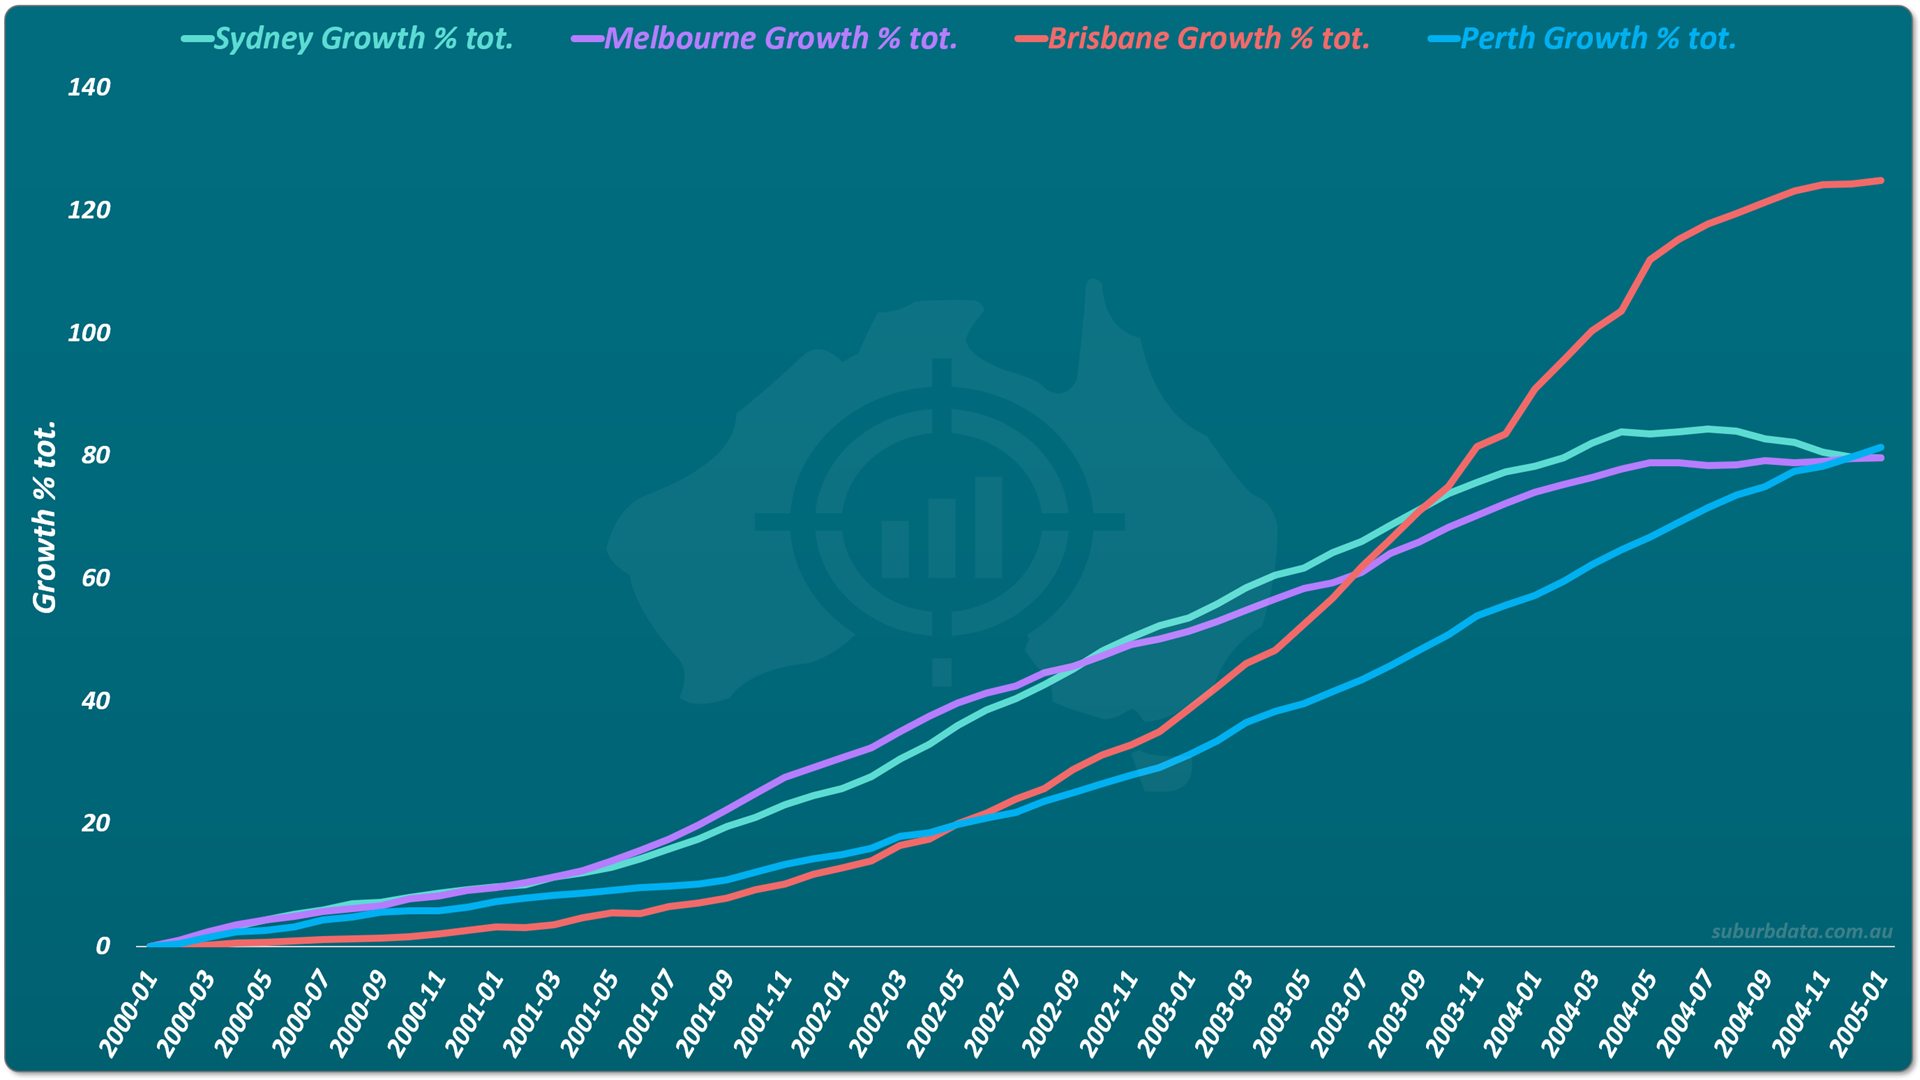
A nationwide boom. All four cities had strong growth. Brisbane was the standout, finishing 45 percentage points ahead of the rest.
The chart below shows the next 5 years, 2005 to 2010.
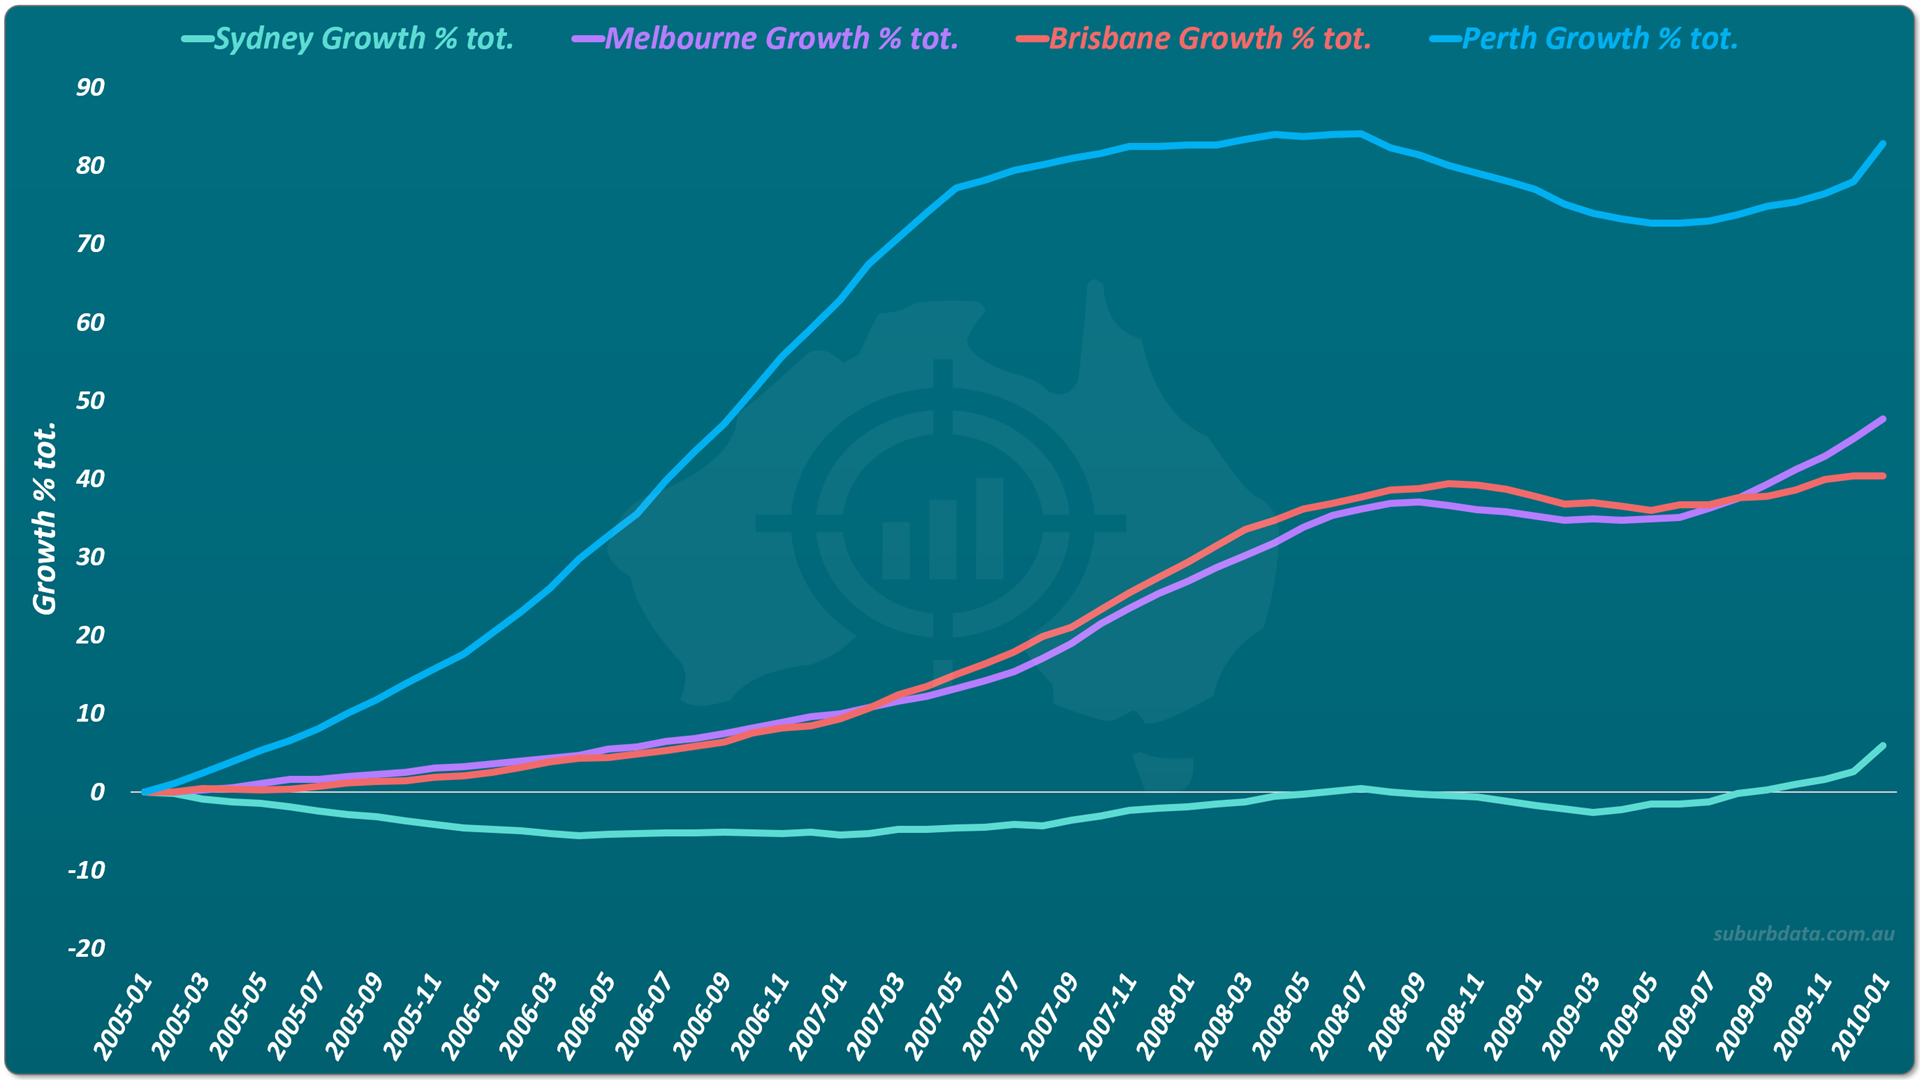
Perth surged 80 percentage points. Sydney spent most of this period below zero.
The chart below shows the next 5 years, 2010 to 2015.
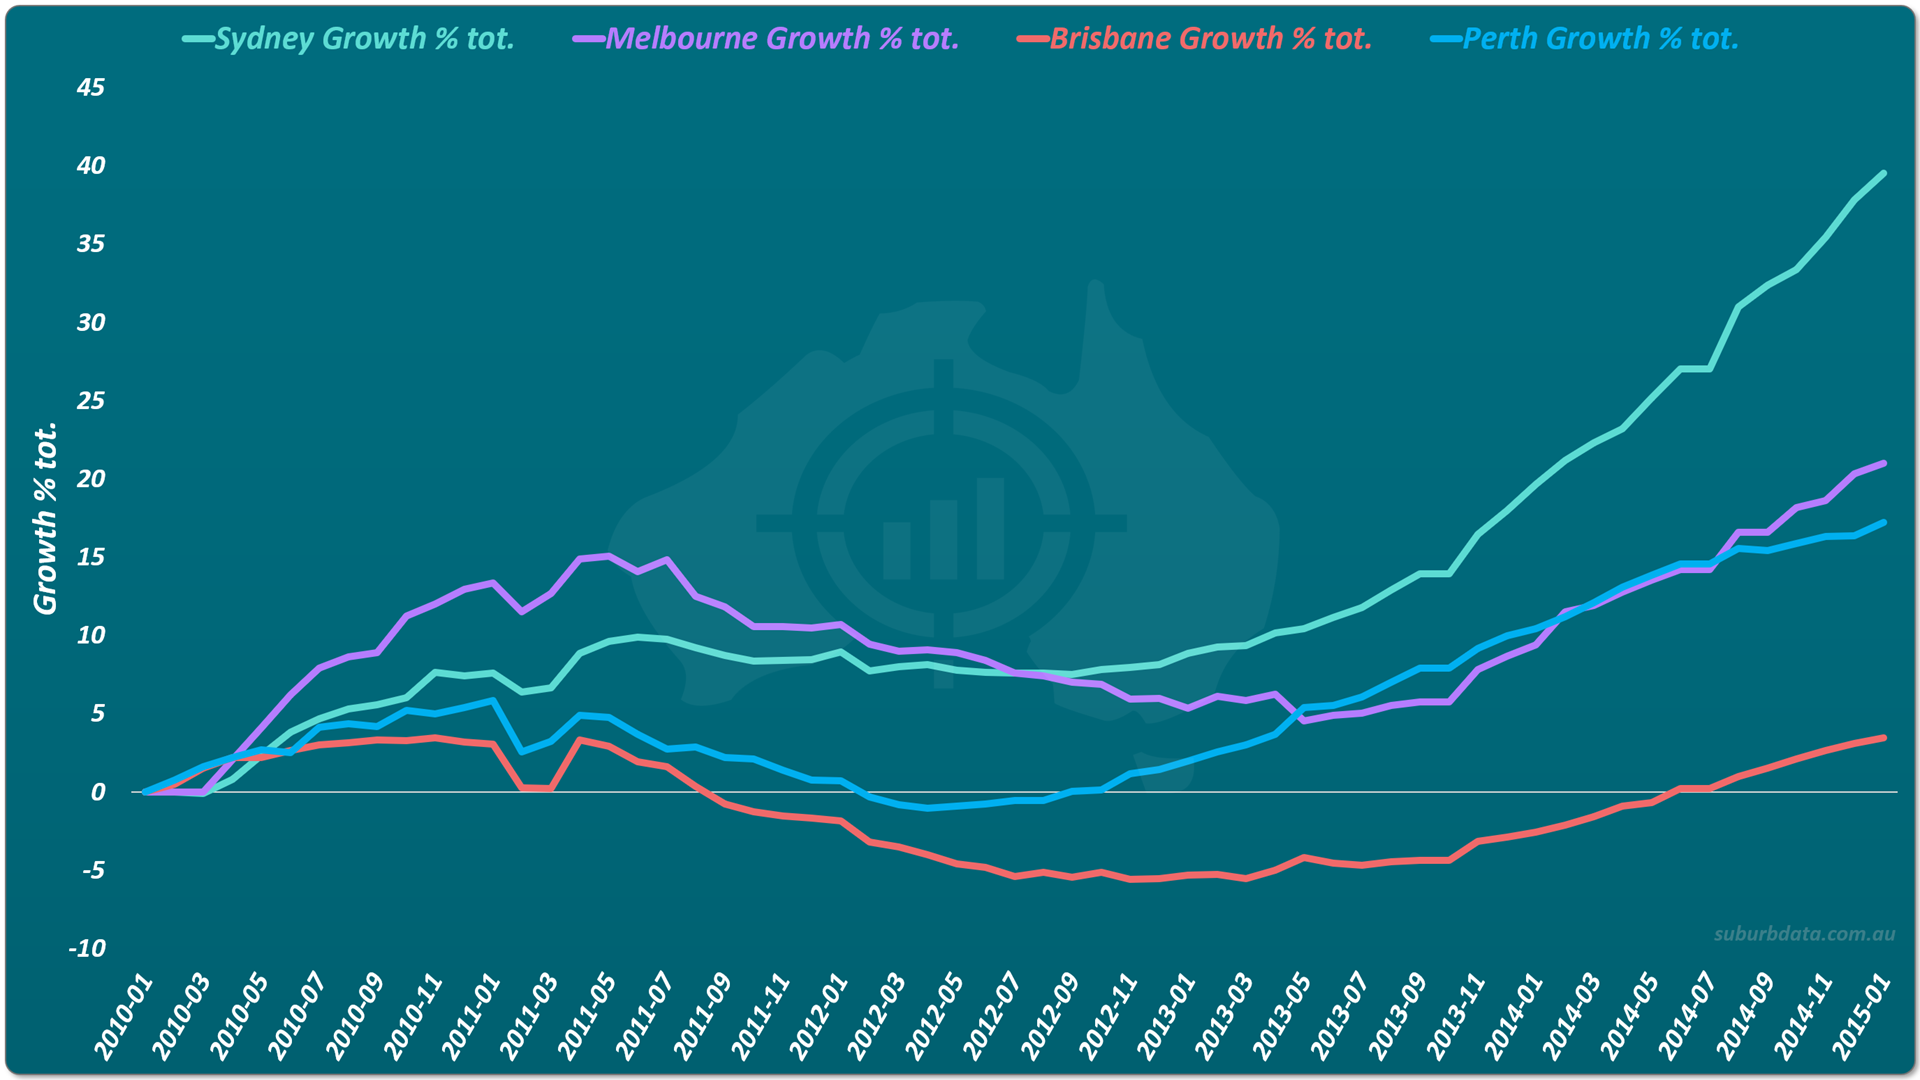
Sydney is now on top, outperforming Brisbane by a considerable margin. For a $500,000 property the growth difference is about $200,000.
Across all five charts, every city had booms, busts, flat periods, and moderate growth. These are the four largest cities by population, with some of the most diversified economies in the country. They are the least volatile markets available. Smaller markets show even more dramatic differences.
The average growth difference between top and bottom across these 5-year intervals was 43%. Booms are short. There is a long wait for the next one.
The Long-Term Resolution
The chart below shows the same four cities over the full 36-year period, 1990 to 2026.
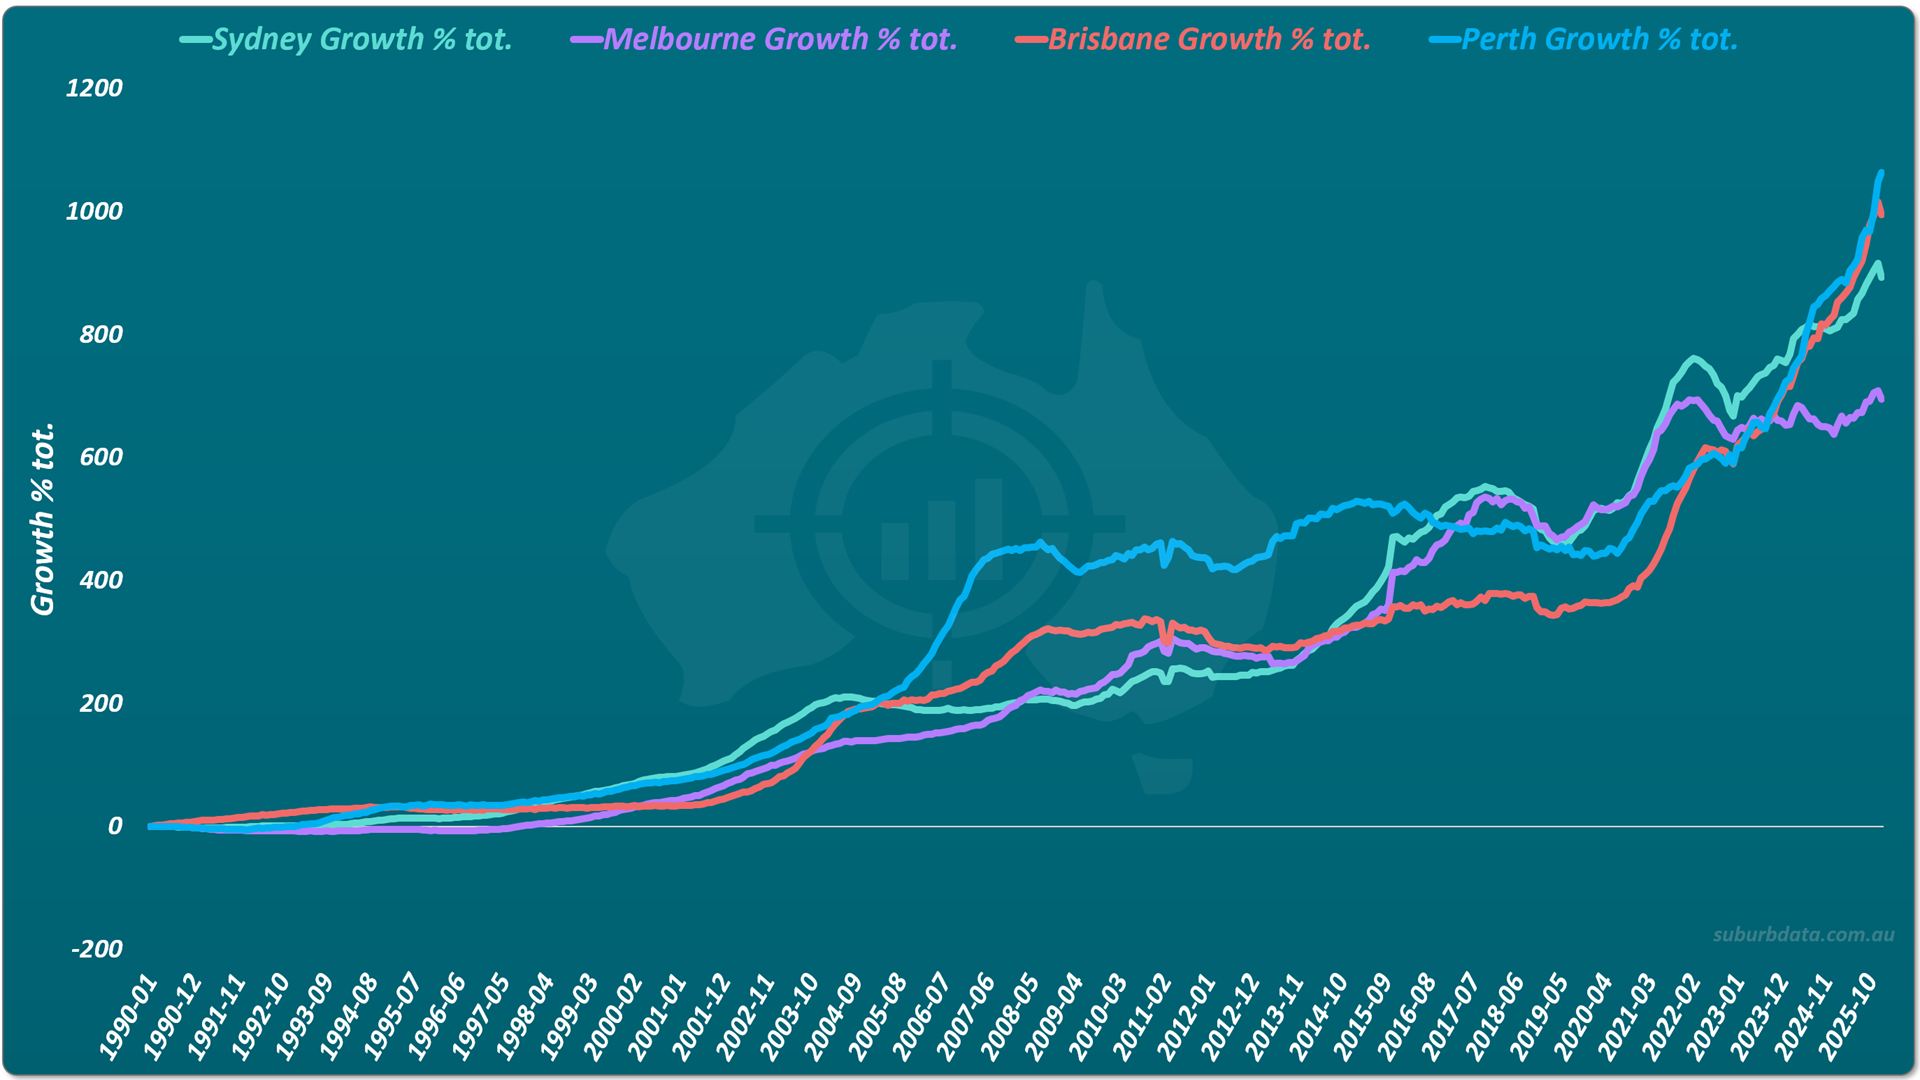
The lines cross repeatedly over 36 years. No city created a continually widening gap. Three of the four cities finish at very similar total growth.
Over the long term, the lead changes too often to call one city better than another. Over the short term, the timing decision is everything.
What It Means
Over a long timeframe, most markets have pretty much the same growth rate. Over a short timeframe, they can have radically different growth rates.
It does not really matter which city you pick. What matters is when you pick it.
Picking the right suburb within a city exaggerates the gap further. Some suburbs outperform the city average. Others underperform it. The 43% average top-to-bottom gap was at the city level, across only four cities. There are over a hundred significant urban areas in Australia, and within each one can be dozens to hundreds of suburbs.
The dollar difference at the suburb level is wider again. The comparison is not 8% per annum against 6% per annum. It is 8% growth total over 5 years against 80% growth total over the same timeframe.
The Long-Term Growth Illusion
Some argue that timing is hard, and picking a "good" location is easier.
The diagram below shows two property markets, A and B, racing each other over time.
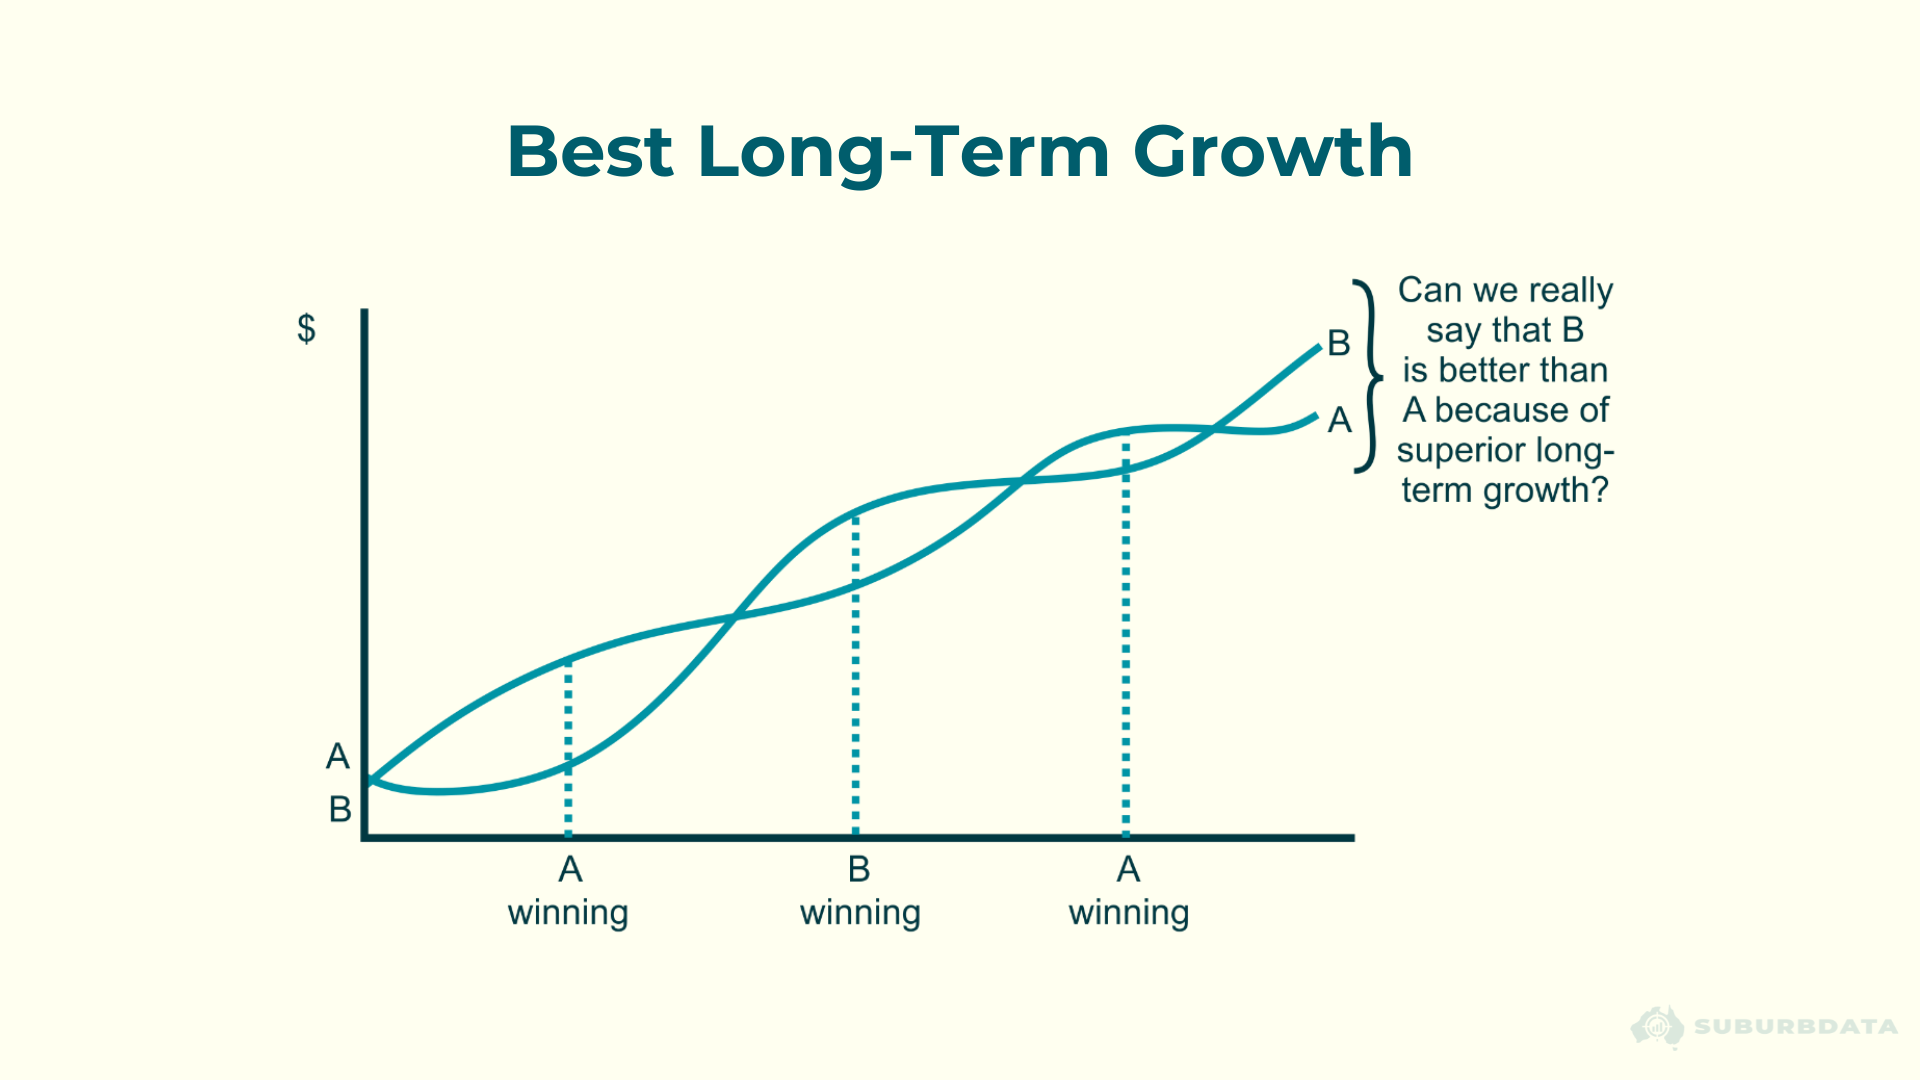
There is no such thing as a permanently "good" location. Over the long term, all locations end up at pretty much the same growth rate.
A location that looks like it has good long-term growth usually has good short-term growth that is recent. Compound growth means most of the total happens late in the timeframe. So whichever suburb has the best recent growth usually has the best long-term growth on paper. The recent timing is the cause.
The difference in performance between two suburbs is more likely a result of good timing than of having picked the right location for the long term.
Timing Is Now Easier Than Location
Timing entry is more accessible than picking location for the long term. The signal is simple: an imbalance between supply and demand. A market where demand exceeds supply has rising prices. A market where supply exceeds demand has falling prices.
Pick a market where supply and demand are out of balance in the buyer's favour. The location takes care of itself.
Conclusion
The historical evidence refutes the old adage of location, location, location. Timing is more important.
Across five 5-year windows, every major Australian city took its turn at the top. The average growth gap between top and bottom was 43%, worth hundreds of thousands of dollars per property. Over 36 years, the lead swapped so many times that no city emerged as permanently better than the others.
Any location will do. The question is when.
For more on this, see EBS 11 (Apples and Oranges), EBS 12 (Long-Term Growth), and EBS 13 (Time-in versus Timing).